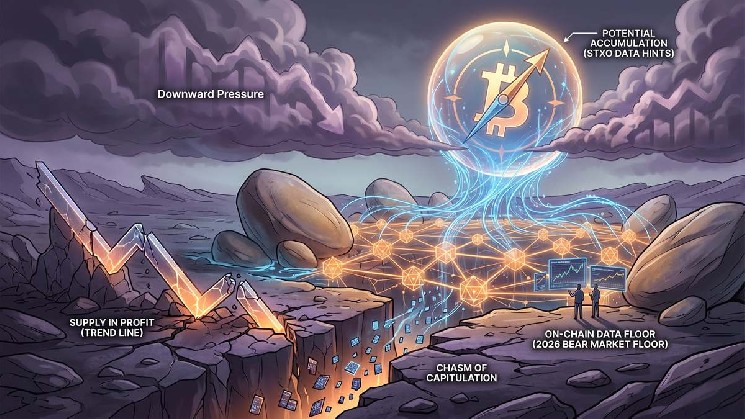
The source’s interpretation suggests that whales are absorbing the selling pressure at current levels. On the other hand, technical documentation shows that retail investors are experiencing a process of capitulation. This asset transfer occurs in an environment where the price has maintained a prolonged corrective trend throughout most of the current year.

Inactivity of long-term wallets
Spent transaction output (STXO) activity corresponding to addresses over five years old shows a holding pattern. Network metrics revealed that this sector of historical investors halted their distribution after recording three defined selling peaks throughout the current cycle.
The first relevant spike occurred in May 2024 with a 90-day moving average situated at 3,860 $BTC. The second increase was located in February 2025 upon reaching 3,200 $BTC, while the last documented peak was set at 2,360 $BTC.
CryptoQuant data shared by analyst Darkfost indicates that the smoothed 90-day average for this group was reduced to 962 $BTC. The analytics platform’s estimates point out that the highest acquisition price paid by this sector of veteran holders is around $63,200. The source’s report assumes that long-term investors prefer to maintain their positions rather than liquidate at current market values.
Derivatives liquidations and liquidity zones
The derivatives contract market experienced an increase in volatility during recent sessions. Liquidation statistics published by the portal livebitcoinnews.com detailed a volume of $404 million in forced position closures, primarily affecting short positions. At the same time, the short-term holder SOPR indicator stood at a value of 0.998239 at the close of June 21, consolidating below the breakeven level.
The market price found dynamic support at the 200-week simple moving average. Commercial flow analyses point out that traders are monitoring a concentrated liquidity zone between $68,000 and $70,000, which functions as the most significant immediate resistance. The asset has not managed to reclaim this operational margin.
A verifiable milestone to determine the market structure will consist of the weekly candle closes above or below the $70,000 liquidity zone during the upcoming month of July.

 crypto-economy.com