u.today
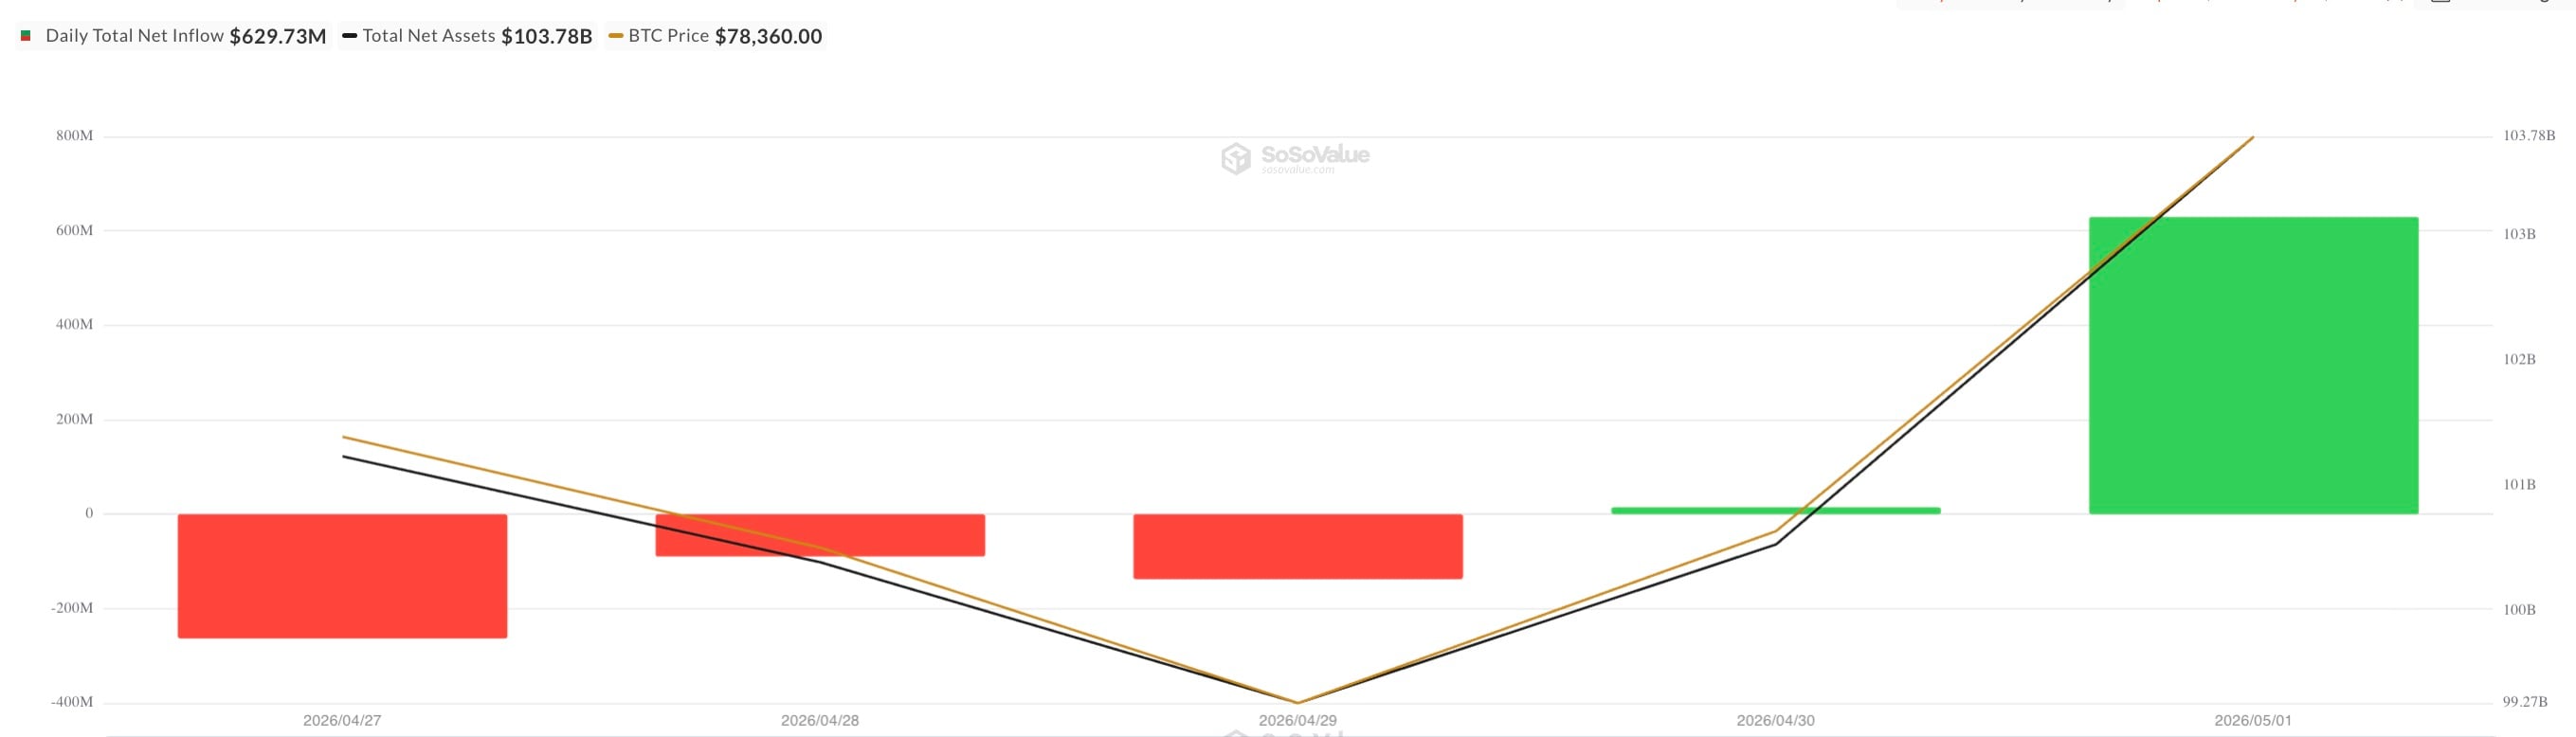
The Bitcoin market has resolved the trend debate - while at the beginning of the week bears tried to push the price down amid outflows from funds, the finale of the week of May 1-3, 2026 turned into both a technical and fundamental trap for short sellers.
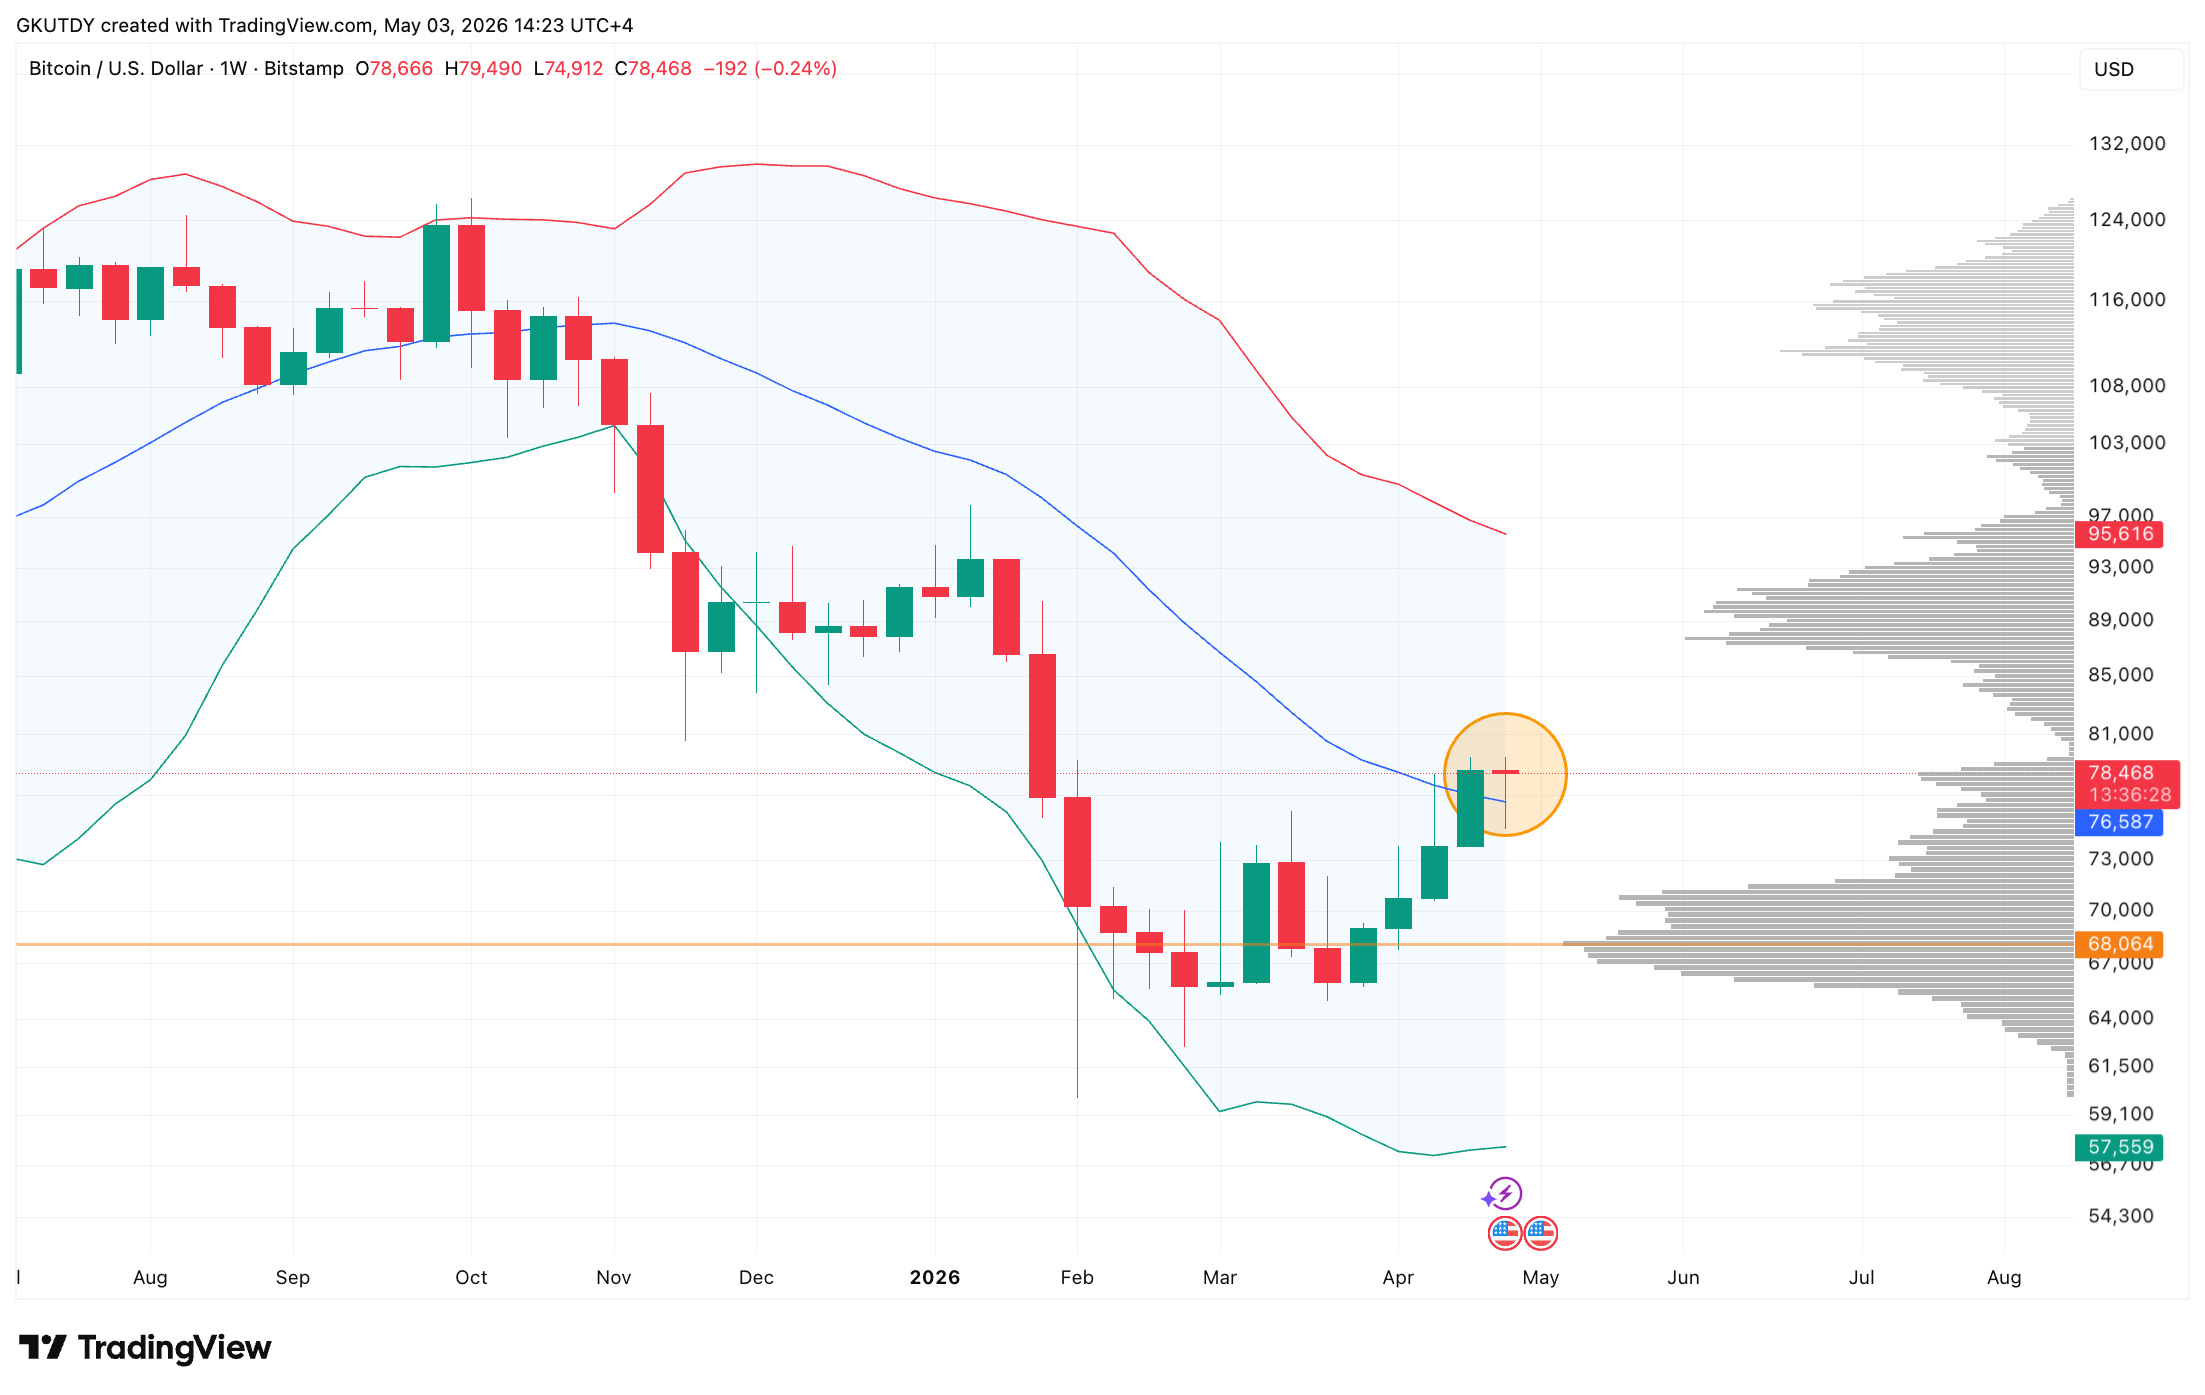
The main feature on the chart is a weekly candle with a long lower wick, which at the time of writing is precisely closing above the middle Bollinger Band at $76,589 as displayed by TradingView.
The price did not just break above this level, but retraced, tested the zone below mid-band for demand, and bounced. Such a wick is the footprint of an aggressive buyer - while retail participants hesitated, "smart money" used the local dip to add to positions.