cryptopotato.com
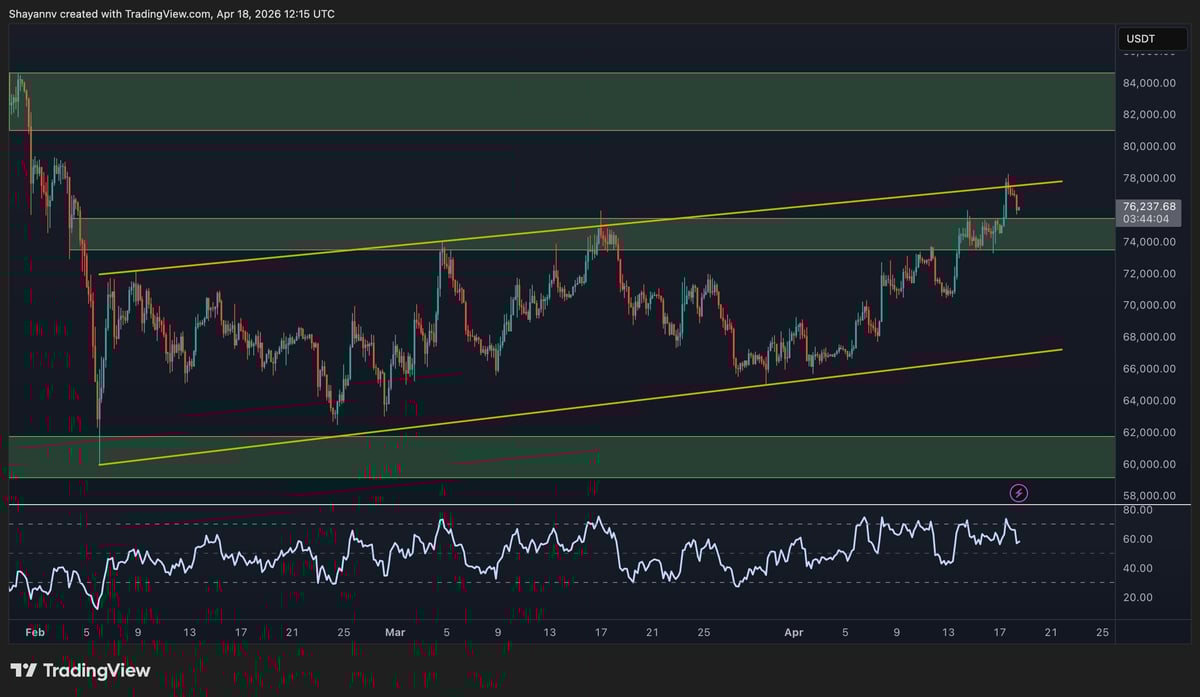
Bitcoin is trading around $76.2k, posting its highest price since the February crash and officially entering the $75k–$80k resistance band that has defined the ceiling of the recent consolidation. The move marks a meaningful escalation in the recovery, with $BTC now breaking above the descending channel and the 100-day MA simultaneously, which could be a very optimistic sign if sustained in the coming weeks.
Bitcoin Price Analysis: The Daily Chart
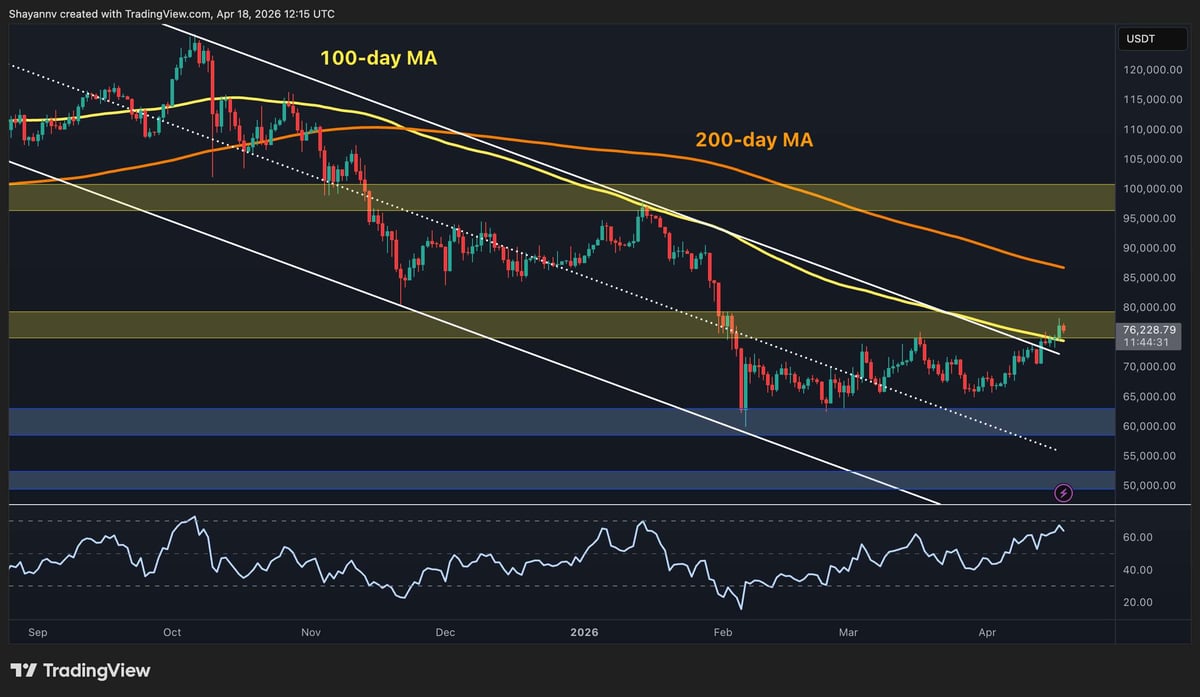
$BTC has broken decisively above both the descending channel’s upper boundary and the 100-day moving average (~$75k) on the daily chart. The RSI is now above 60, showing its highest reading since January when $BTC was trading around $95k. This is the most constructive daily setup over the past couple of months, and for the first time, the technical weight of evidence is beginning to tilt in favor of buyers rather than simply suggesting seller exhaustion.
The immediate focus shifts to whether $BTC can close above the $75k–$80k resistance zone and establish it as a support level. This zone can serve as a key floor for the upcoming months, and reclaiming it on a sustained basis would be a significant structural development. Above it, the 200-day MA (~$86k–$87k) and the $95k–$100k critical supply zone represent the next major obstacles. On the downside, the channel’s former upper boundary can be counted on for a retest and bounce, with the $60k area as the deeper floor.