The reading mattered as it arrived while the price still hovered near $66,800. In simple terms, traders were becoming more fearful even though the market had not broken lower. That divergence made sentiment a bigger story than the daily price move itself.
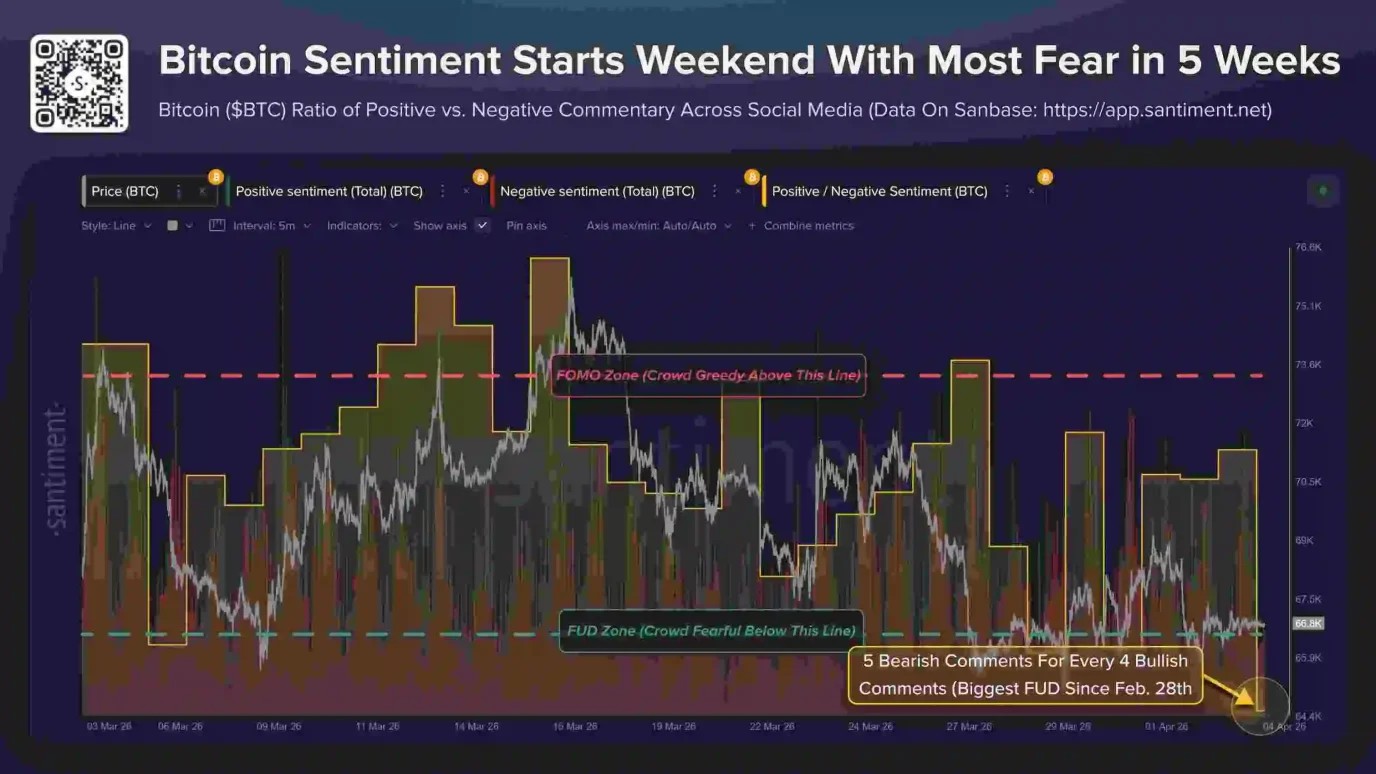
Bitcoin Sentiment (Source: Santiment’s X)
Similarly, the prolonged flat trading recently appears to have added to that fatigue. The report described a market where upside momentum has failed to return with conviction. As a result, online discussions have shifted away from recovery and toward downside risk.
Santiment did not describe the development as a pure sell signal. Instead, it said extreme pessimism can become an important market condition to watch. That is because crowd positioning often turns most negative near important inflection points.
Iran Headlines Add Pressure to a Defensive Market
The weak mood also formed against a tense geopolitical backdrop. According to the data provided, President Donald Trump warned Iran to make a deal or to reopen the Strait of Hormuz. He also said the United States would “rain hell” on the country.
This warning followed a previous threat to revert Iran to its primitive state. The supplied text said the US would continue bombing infrastructure, including bridges and power sources. Trump’s ten-day deadline was set to expire on Monday this week.
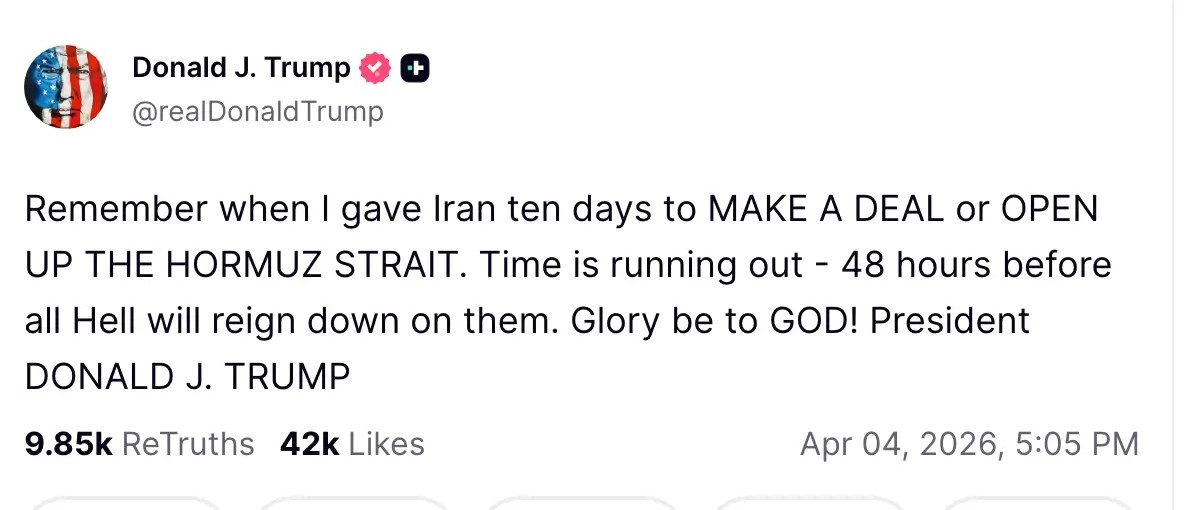
President Donald Trump’s Warning to Iran (Source: Truth Social)
Those developments fed directly into a broader risk-off tone. Santiment identified the Iran war and debate around the Clarity Act as major overhangs on sentiment. Both issues appeared to dampen optimism, even as the price remained above recent support zones.
Historically, April has been one of Bitcoin’s strongest months. The asset finished higher in 10 of the last 15 Aprils, with an average gain of 20.9%. Still, the text noted that seasonality does not easily override war risks, negative Coinbase Premium data, and whale distribution.
Is $60K the Next Key Level in This Setup?
The supplied chart analysis from CRYPTOWZRD added another layer to the discussion. The analyst highlighted a recurring bear-market pattern tied to the 200-week exponential moving average. In prior major downturns, bottoms formed only after prices fell roughly 29% to 31% below that line.
This time, the numbers look different. The weekly chart showed Bitcoin price near $67,317, while the 200-week EMA stood around $59,438. That means the market remained above the deeper capitulation zone seen in earlier cycle lows.
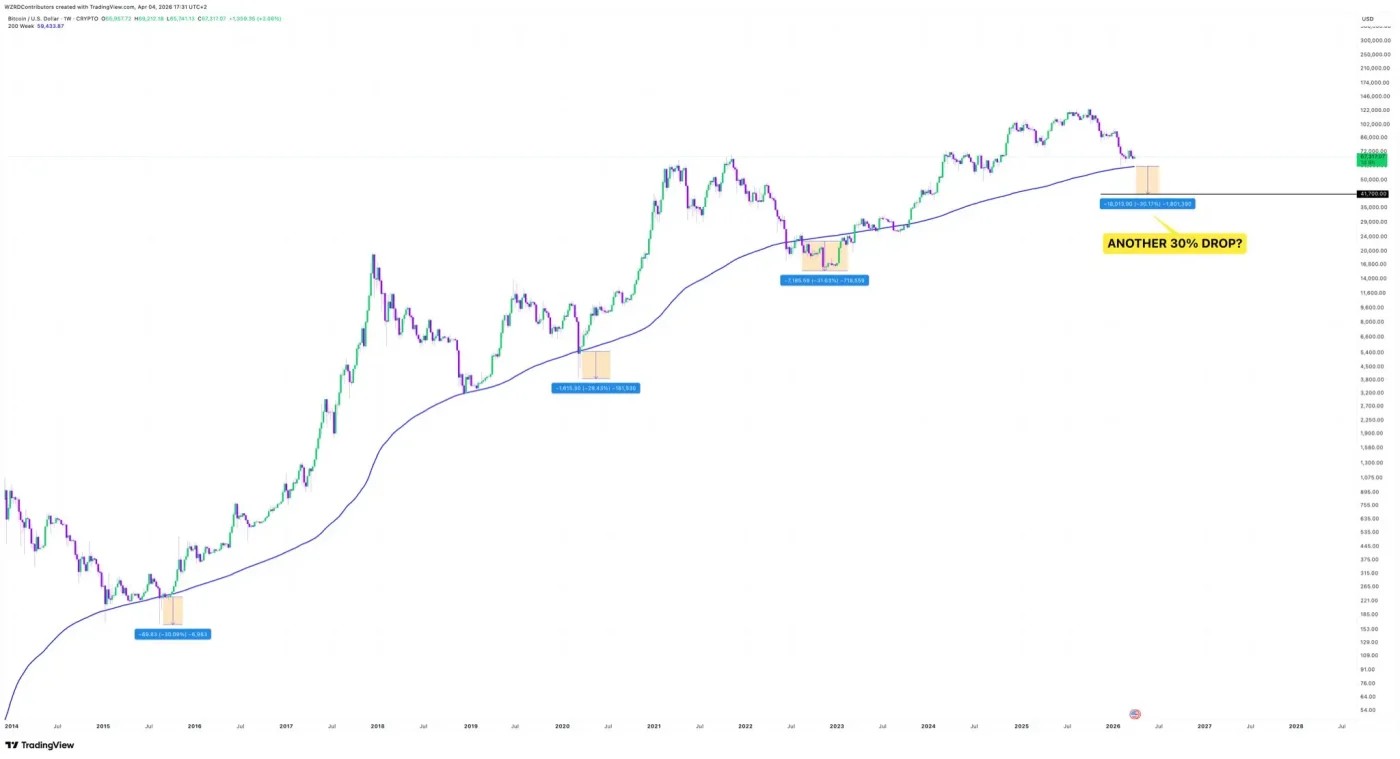
Bitcoin 1-Week Price Chart (Source: CRYPTOWZRD’s X)
On the current chart, that setup implies a move likely well below the 200-week EMA again, with the projected downside zone landing closer to the low-$40,000 range rather than $60,000. That makes the analyst’s prediction more aggressive than a simple retest of the long-term average.
Even so, the chart presents the scenario as a historical comparison, not a confirmed outcome. The message is that if Bitcoin repeats prior cycle behavior, another 30% drop beneath the 200-week EMA could still be possible.
Also Read: HYPE Extends Rally as Traders Debate Whether the Token Is Now Overpriced

 cryptonewsz.com