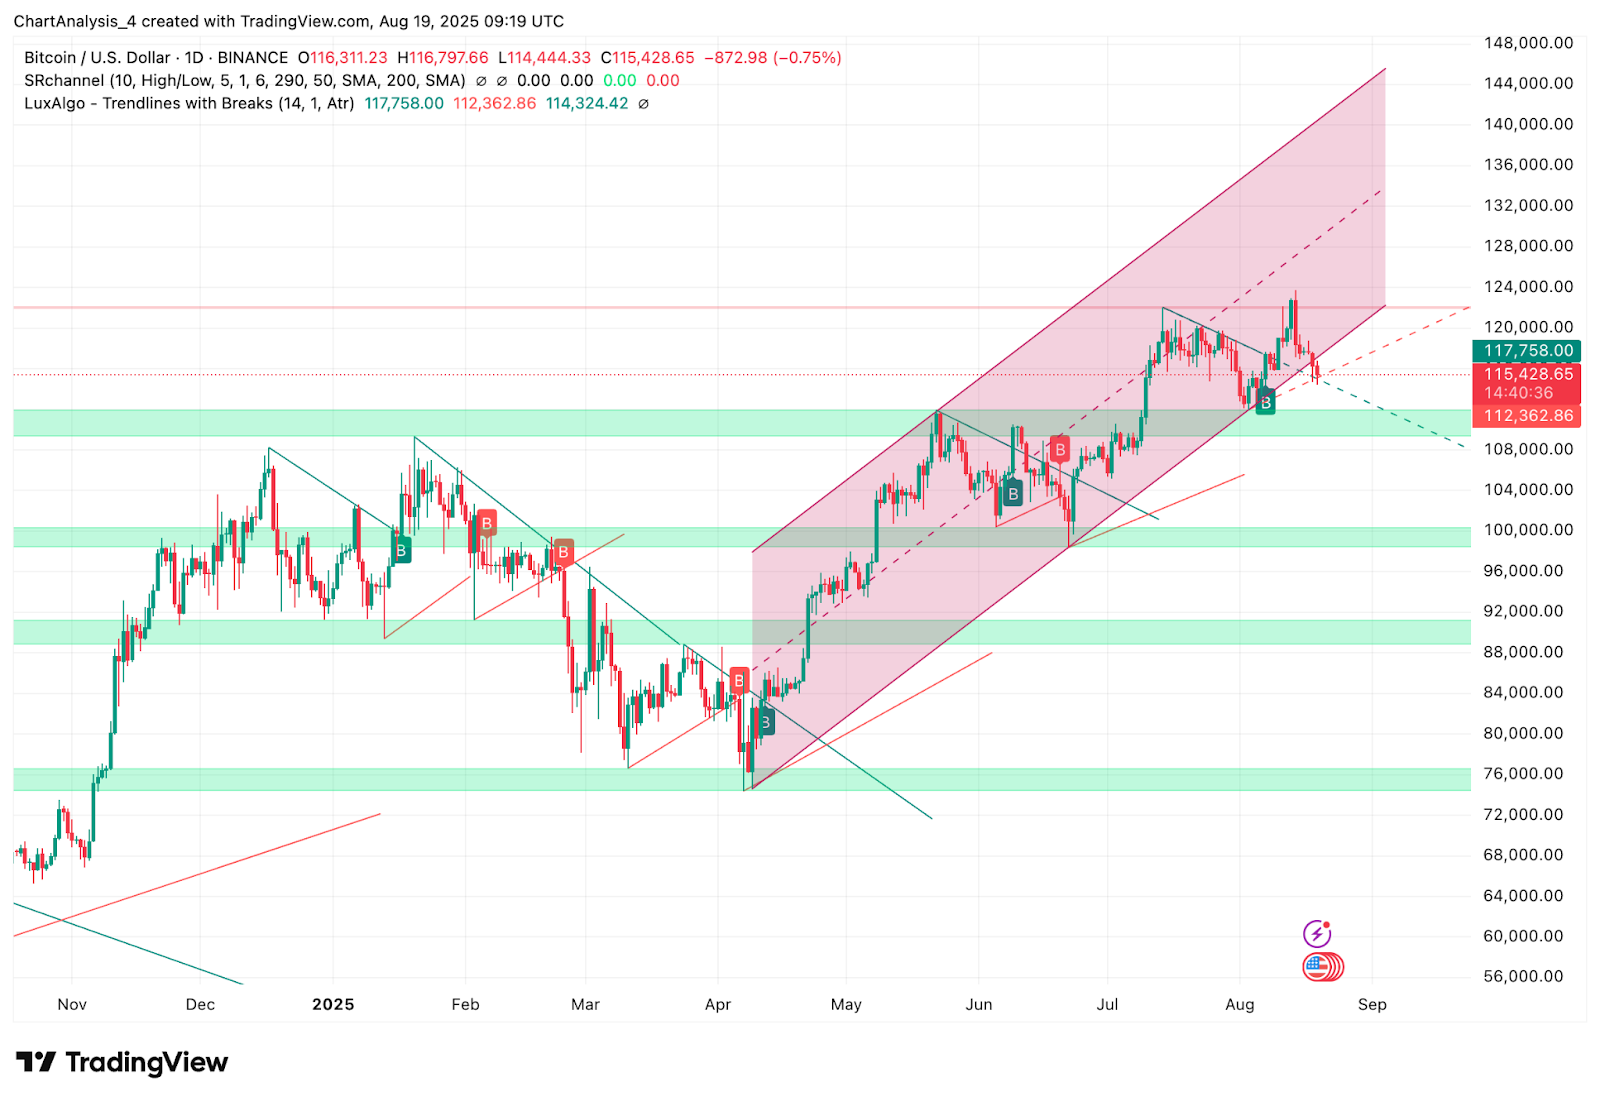
On the daily chart, $BTC remains inside an ascending channel, but price has pulled back from the upper band near $120,000. The rejection aligned with a weak high confirmation, leaving the market vulnerable to a retest of mid-channel supports. Strong demand lies at $112,300 and $114,300, levels that have repeatedly attracted buyers over the past month.

$BTC price dynamics (Source: TradingView)
The volume profile analysis shows that there are a lot of bids between $113,000 and $115,000, which makes this range an important pivot point. The Chaikin Money Flow on the 4-hour chart has gone below zero, which means that money is leaving the market, but it isn’t bad enough yet to break the trend structure.
Why Is The Bitcoin Price Going Down Today?

$BTC price dynamics (Source: TradingView)
The reason behind why Bitcoin price going down today stems from repeated failures to clear the $120,000 resistance band. Price action has formed equal highs near $119,500–$120,000 before a change of character (CHoCH) shifted momentum lower. This aligns with heavy supply absorption at the top of the channel, suggesting profit-taking by whales.
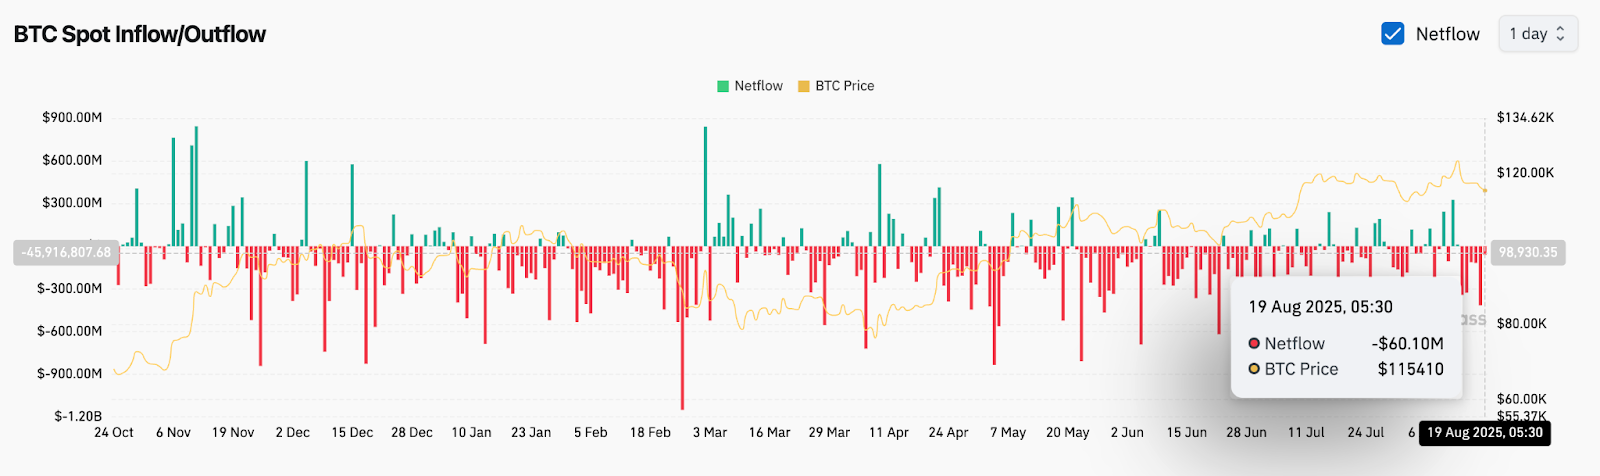
$BTC On-Chain Analysis (Source: Coinglass)
Spot netflow data supports this view, showing over $60 million in outflows on August 19. The move coincided with $BTC’s pullback from $116,800 to $115,400, highlighting how exchange flows are influencing short-term volatility.
Indicators Signal Mixed Bias Around $115K

$BTC price dynamics (Source: TradingView)
The 4-hour EMAs (20/50/100/200) are all very close together, between $116,400 and $117,500. $BTC is now trading below them. This bearish stack shows that bulls need to get back above $116,800 to get things moving again. The Bollinger Bands are getting tighter after a big expansion at the beginning of the month. This means that volatility is building up and could lead to a big move in one direction.
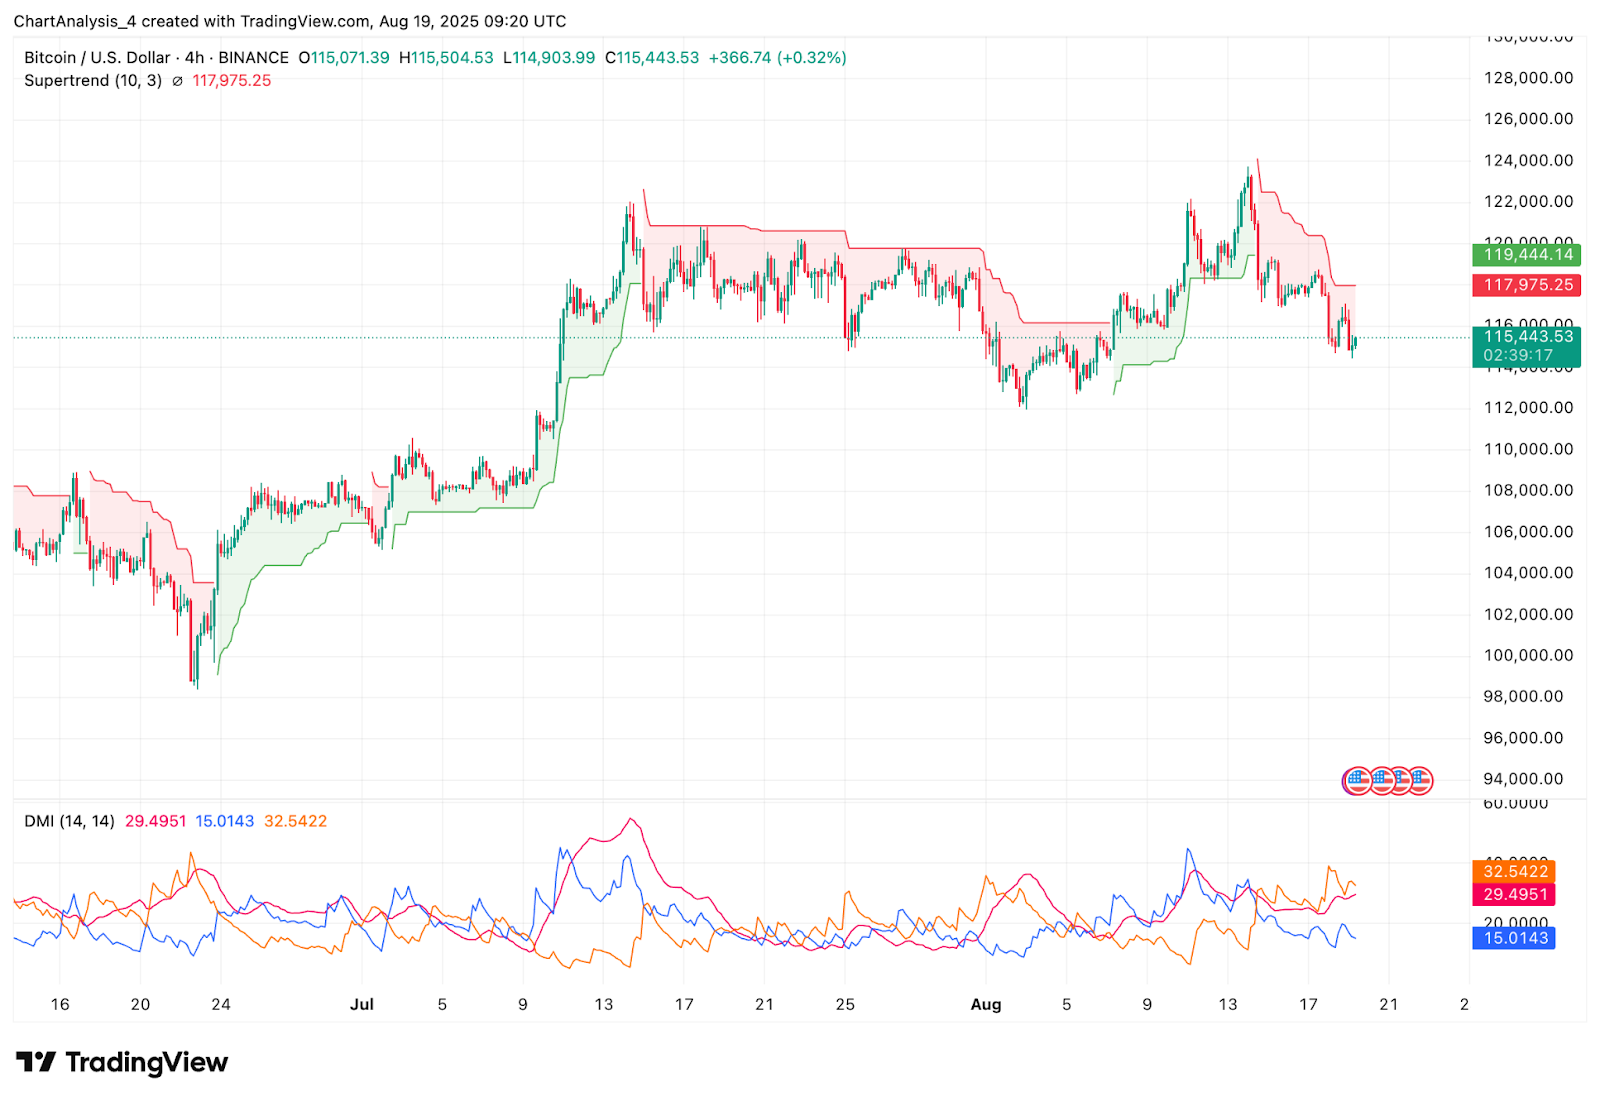
$BTC price dynamics (Source: TradingView)
Directional Movement Index (DMI) readings show the -DI leading above +DI, with ADX rising toward 32, pointing to a strengthening bearish bias. At the same time, liquidity zones mapped by Smart Money Concepts highlight untested demand blocks at $112,500 and deeper at $109,000. Also, the Supertrend indicator flipped bearish at $117,900 on the 4-hour chart, adding another technical headwind for bulls in the immediate term.
Still, $BTC remains well above its broader support structure near $100,000–$102,000, where the 200-day EMA and prior breakout zone converge. As long as this zone holds, the macro uptrend remains intact despite near-term weakness.
$BTC Price Prediction: Short-Term Outlook (24H)
For the next 24 hours, Bitcoin price today is likely to trade within a compression band between $114,000 and $117,000. A breakout above $117,500 with volume confirmation could open the door for another retest of $119,500–$120,000. Beyond this, a clean break would expose $123,700 and potentially $127,000 as the next upside targets.
On the downside, if $BTC loses $114,000, the next major support lies at $112,300, followed by $111,000. A decisive breakdown below these levels risks dragging price back toward the $108,000–$109,000 demand cluster.
Given mixed momentum signals, traders should closely monitor whether $BTC can defend $115K support or risk a deeper correction into the $112K zone.
Disclaimer: The information presented in this article is for informational and educational purposes only. The article does not constitute financial advice or advice of any kind. Coin Edition is not responsible for any losses incurred as a result of the utilization of content, products, or services mentioned. Readers are advised to exercise caution before taking any action related to the company.

 coinedition.com