
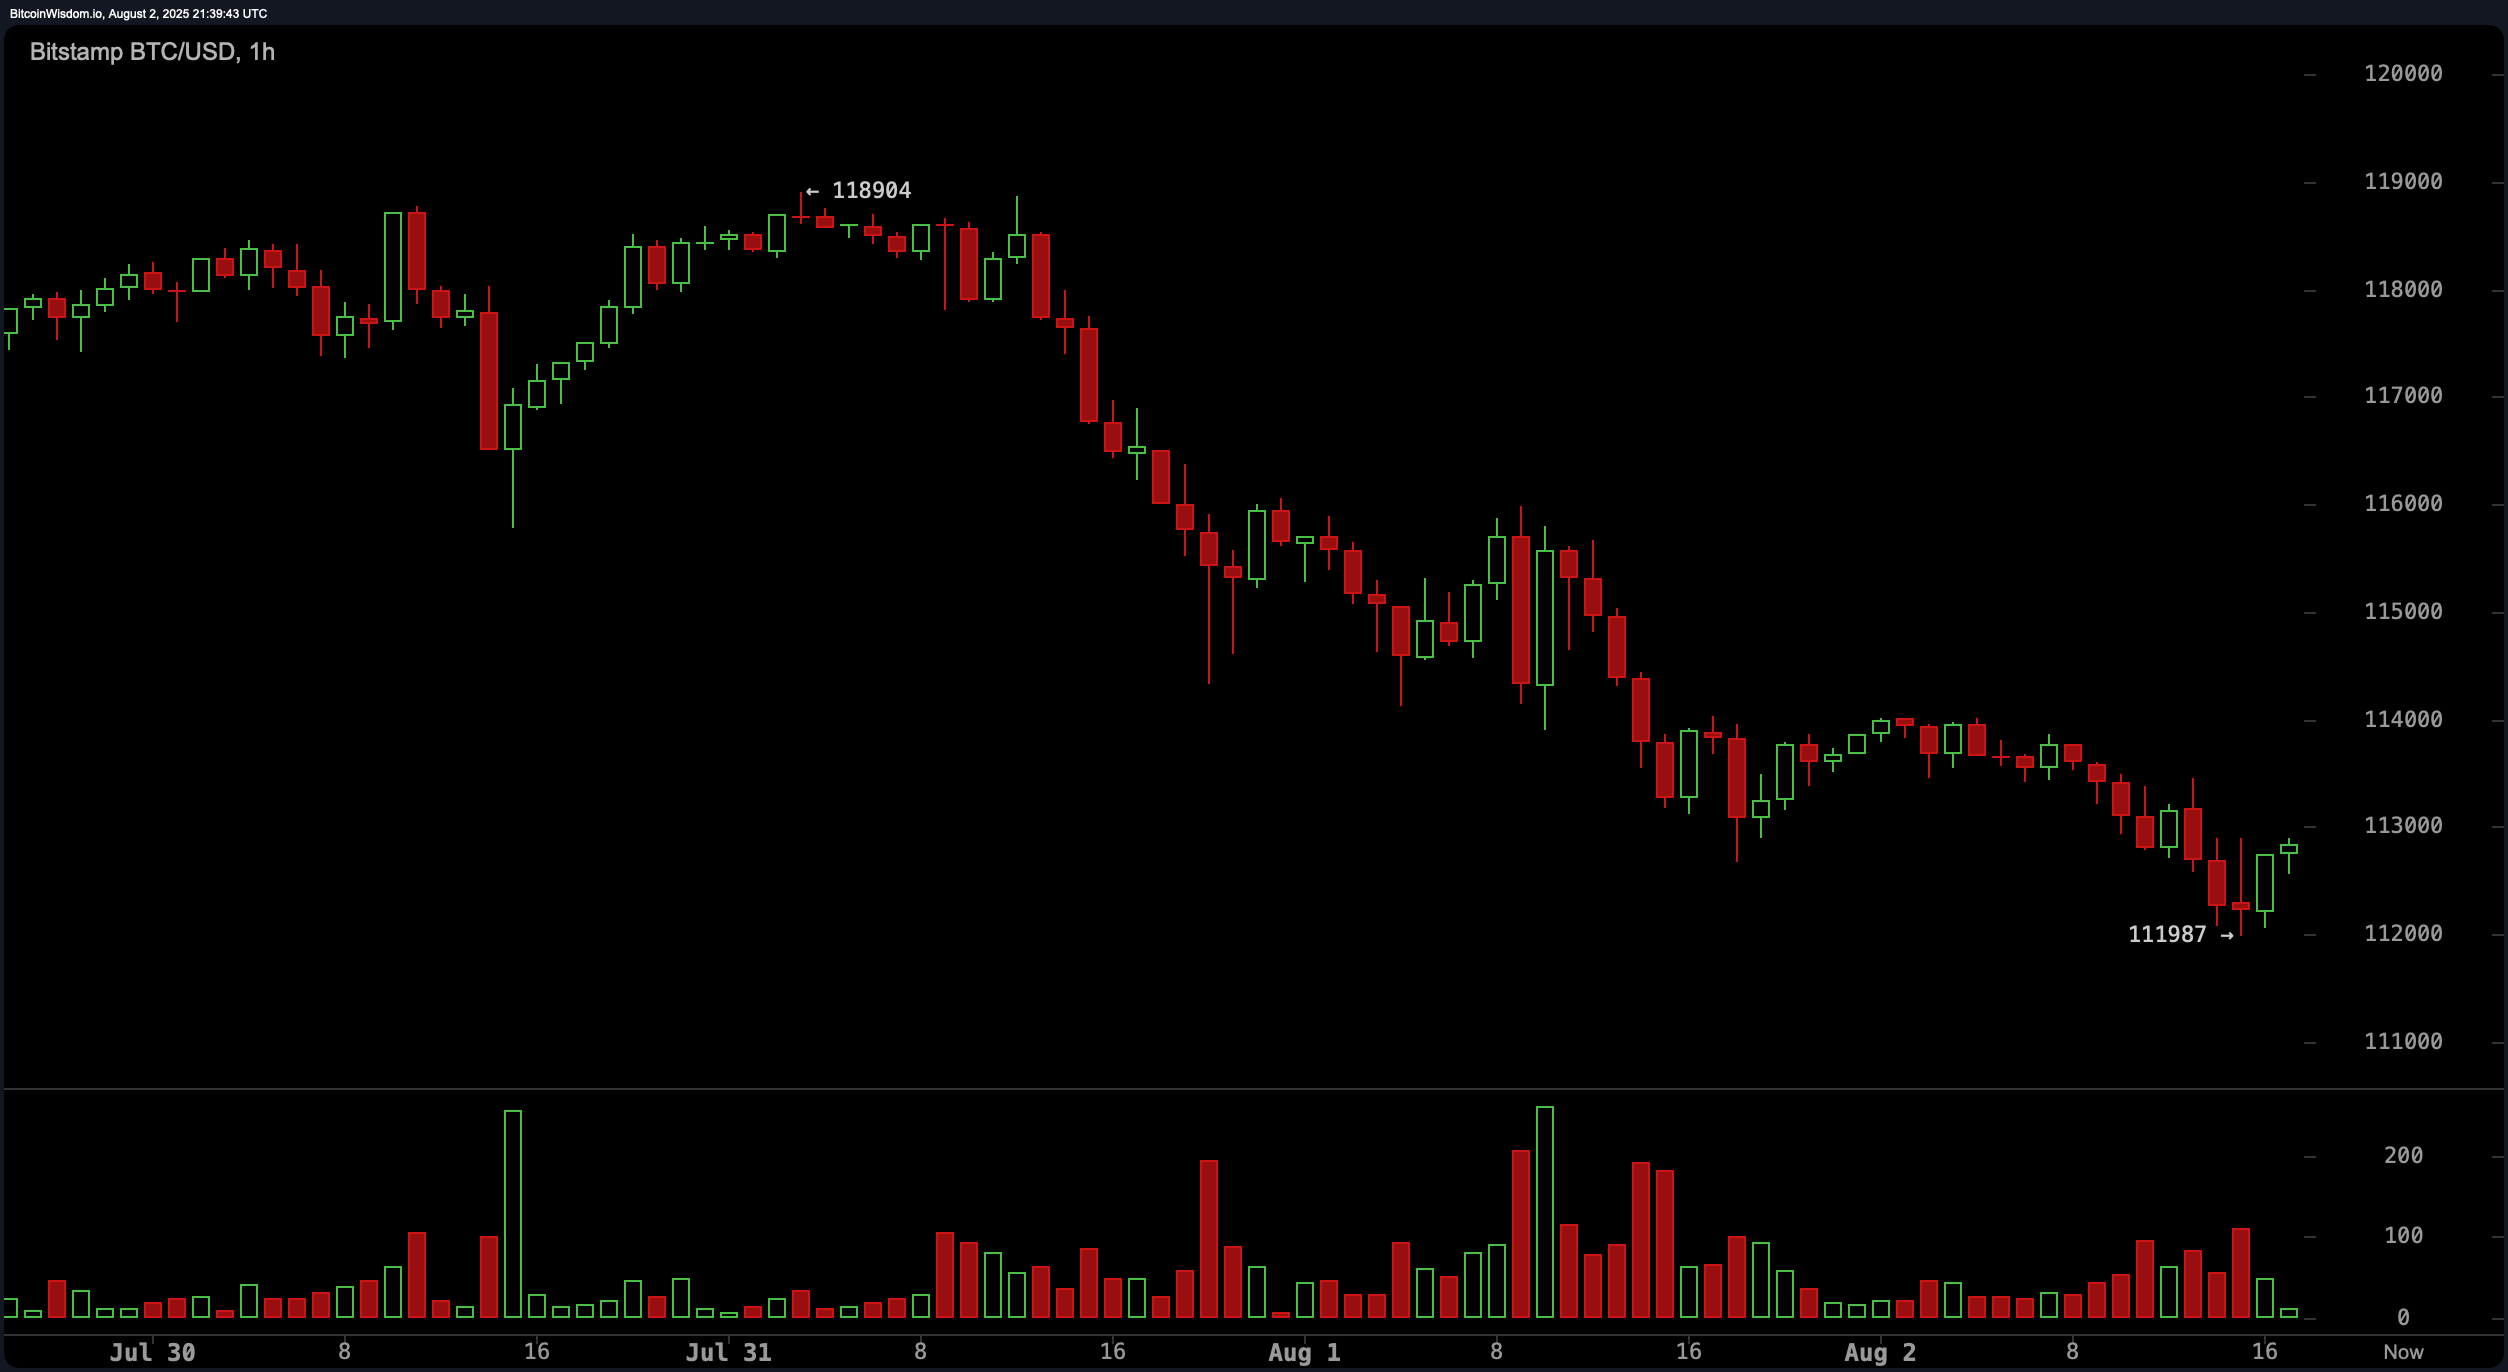
On Saturday at 6 p.m. Eastern time, bitcoin is changing hands at $112,985 after dipping to an intraday low of $111,987 from highs near $123,000 in recent weeks, with both futures and options metrics flashing mixed signals across major derivatives exchanges.
Bitcoin Dips but Deribit Traders Still Eye $140K+ Strike Prices
Bitcoin is down 4.6% this week with a market cap of $2.23 trillion and a 24-hour trading volume of $36.35 billion. On the daily chart, $BTC has been trending lower since mid-July, with consecutive bearish days pushing it below short-term support.
The hourly chart confirms steady selling pressure, bottoming out at $111,987 during the U.S. morning session. Despite the decline, the daily volume remains moderate compared to the high-volatility stretches seen in late May and early July. At the same time, bitcoin derivatives markets are telling a whole other story from top to bottom.
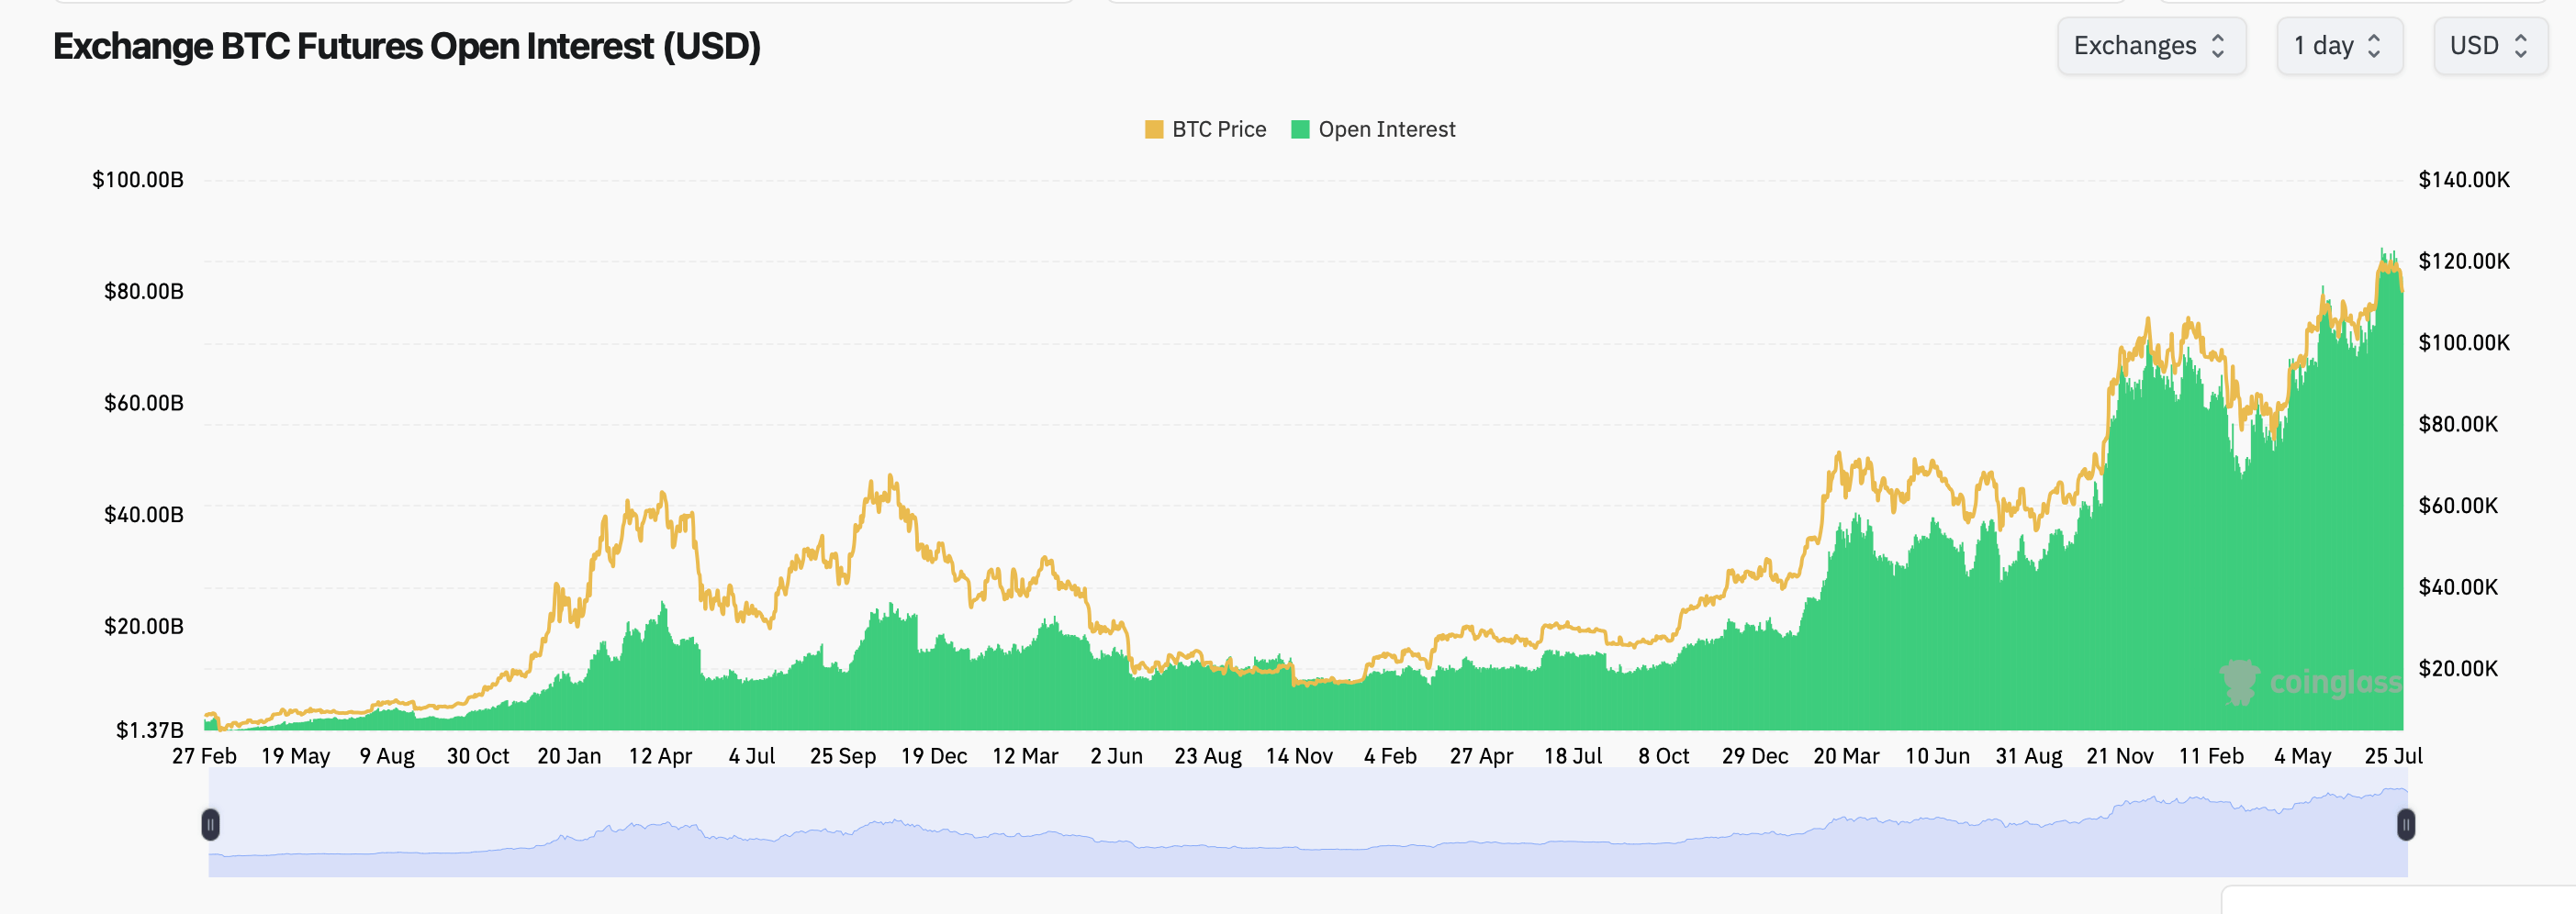
Futures open interest (OI) sits at $80.14 billion across all exchanges, according to coinglass.com metrics. CME and Binance lead at $15.94 billion and $14.12 billion, respectively. Bybit showed the most aggressive 1-hour OI increase at +0.31%, while MEXC’s OI climbed 1.32% over 24 hours.
However, 24-hour liquidations topped $577.19 million on Saturday, with longs taking the bulk of the damage—$514.50 million compared to $62.70 million in short positions. Ethereum traders were hit hardest with $185.7 million in both long and short liquidations, followed by bitcoin at $93.67 million. This suggests overleveraged long positions were flushed as prices slid lower.
Despite bearish spot action, options traders appear optimistic. Calls represent 61.8% of all open interest in the $BTC options market, with 210,458.73 $BTC in call positions versus 130,099.39 $BTC in puts. In the past 24 hours, however, volume shifted more evenly, with 54.99% going to puts and 45.01% to calls—reflecting short-term defensive positioning.
High-interest strike prices include the Dec. 26, 2025, $140,000 call (10,616.4 $BTC in OI) and even a bold $200,000 call (8,685.7 $BTC). This signals confidence in long-term upside, even as $BTC struggles to hold the $112K level.
Oscillators lean neutral to weakly bearish. The relative strength index (RSI) is at 40, while the MACD level is signaling a sell. The commodity channel index (CCI) is deeply negative at −293, often interpreted as a potential buy zone. Momentum has flipped to −6,171, suggesting downward force is in play.
Moving averages are mixed. The 10-, 20-, and 30-day simple and exponential moving averages are all flashing sell signals. However, the 50-, 100-, and 200-day SMAs and EMAs are still pointing to a longer-term uptrend, with the 200-day SMA at $99,213 and EMA at $100,471.
Bitcoin is navigating a technical correction amid solid derivatives activity and heavy long liquidations. Short-term indicators suggest more room to the downside, while options and longer-term moving averages hint at underlying bullish sentiment.
Whether $BTC consolidates or continues its decline may hinge on macroeconomic data and derivatives rebalancing early next week.