Bitcoin is trading in a Wednesday`s range with the potential for more gains after Tether injected $6 billion USDT into the market.
Bitcoin has more room to grow, according to Satoshimeter, and historical cycle analysis shows Bitcoin’s highs could hit the $200,000 to $500,000 range.
Currently, Bitcoin’s price remains inside the range of Wednesday’s trading session. It saw an impressive bullish move that commenced at the beginning of the week.
The coin is now trading slightly below $91 500 after recording a surge of 20% since November 10, which saw BTC hitting a new high of $93,433
Tether has recently issued an additional 2 billion USDT on Tron and Ethereum. This adds up to its recently issued 8 billion USDT over the course of 8 days.
Of this, a total of 6.067 billion USDT has already been pumped into the cryptocurrency market. Large chunk being transferred to crypto exchanges such as Kraken, Binance, and Coinbase.
Such inflations in liquidity can act as a big factor for Bitcoin. This can push the prices of Bitcoin to a higher range, possibly above $93,000, inching even closer to setting yet another record high.
Tether minted another 2B $USDT on #Ethereum and #Tron an hour ago!
— Spot On Chain (@spotonchain) November 14, 2024
In the past 8 days, Tether has minted a total of 8B $USDT. Of these funds, 6.067B $USDT has been injected into the crypto market, backing #Bitcoin to rise above $93,000—a new all-time high.
Follow @spotonchain… https://t.co/hsdqBkU9y4 pic.twitter.com/oYqIMhoufR
According to the report, Kraken has acquired the larger percentage, followed by Binance Coinbase metrics.
Such injections paint a picture of a great liquidity enhancement. It is either reflected in readiness for likely enhanced trading activities or to back speculated price shifts in the market.
2022-2025 Cycle Suggests a Major Bull Run
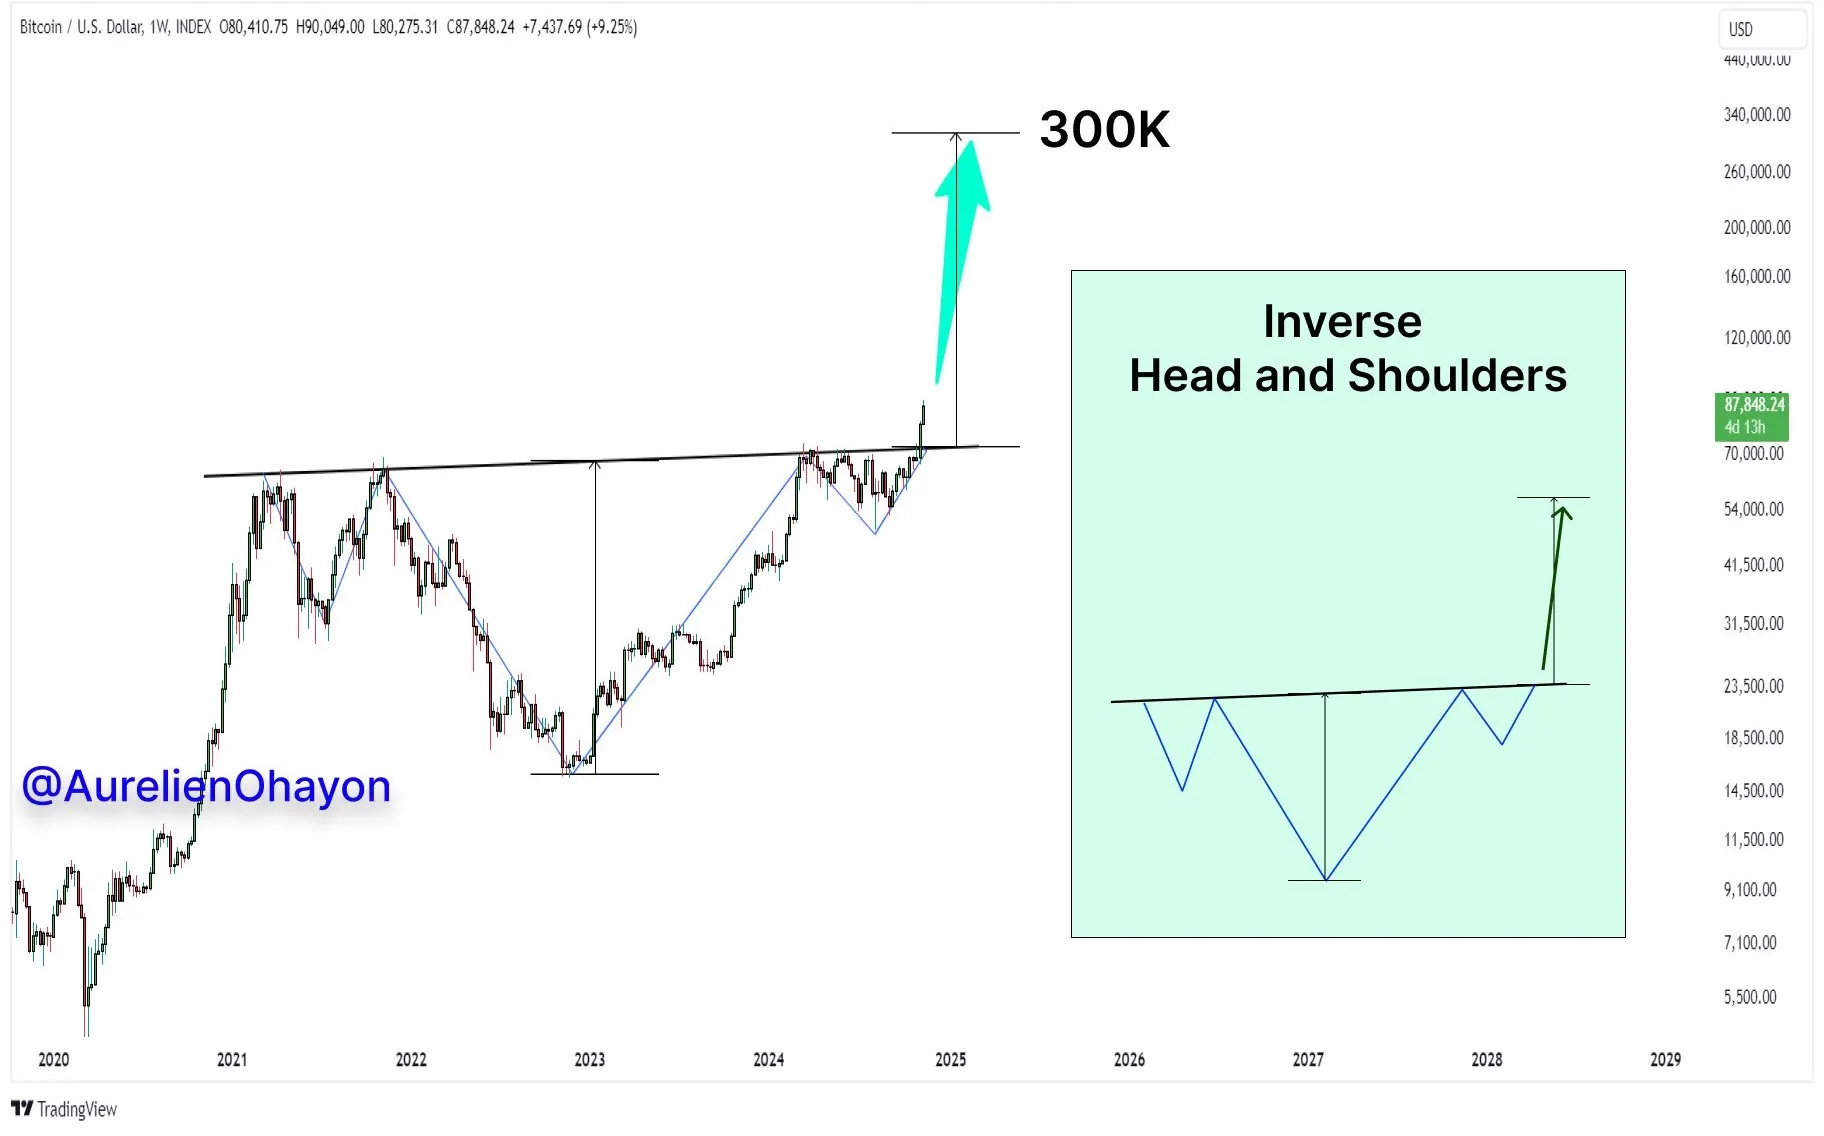
Aurelien Ohayon compares the price cycles of Bitcoins in the years 2014 to 2017. The cycle expected to take place from 2022 to 2025, and this possibly creates room for a new bull run.
The analysis demonstrates the three phases that occur in each cycle, marked with an index of 1, 2, and 3, respectively, with each of these phases experiencing a remarkable price growth.
The analysis starts with a wedge that is set to descend (phase one) until, at last, it breaks out and thus serves the purpose of moving upward.
This was then followed by a phase of continued rise (phase two) after the prices started to rise more and more following a halving.
The third phase marks a scenario when the prices escalate to the highest, which is also the highest peak in relation to the bull run.

The predicted cycles for 2022-2025 display approximate similarity with the structure of the previous bull once.
Suggesting that there is a possibility of Bitcoin reaching and exceeding its all-time high after the upcoming halving event.
The green box on the chart shows where the estimated price targets lie. They are between $200,000 and $500,000 if this pattern continues, proving that a massively bullish trend is upcoming.
Satoshimeter Indicates Bitcoin is Far from Peak, Growth Potential Ahead
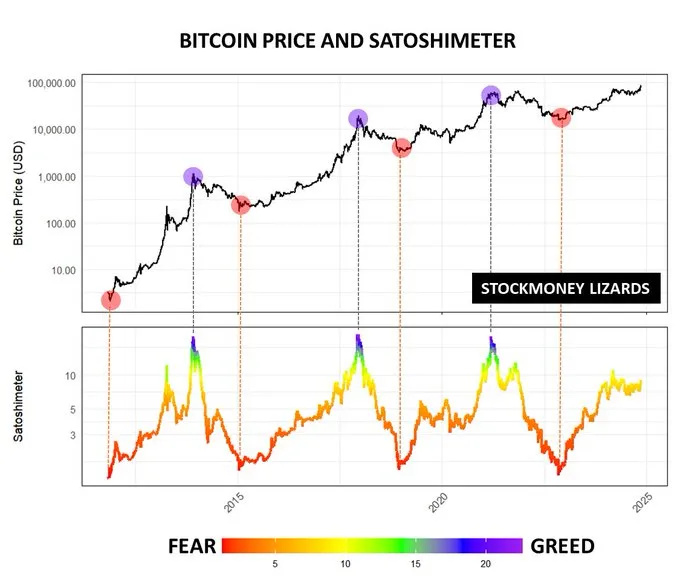
The Satoshimeter graph appears to show that Bitcoin is still at the mid-stage of the market cycle. But it has a chance of getting up significantly.
According to the current value of 13, the Satoshimeter argues that the market does not appear to have toppish conditions.
That dispels any suggestions that the final bull thrust might have occurred in Bitcoin as well. The Satoshimeter uses on-chain data to analyze and follow the cycles of Bitcoin.
They also match the key historical phases. Historical records show that values around 1.6 on the Satoshimeter have been regarded as the bottoming out points of bear markets.
This has happened in 2011, 2015, 2019, and 2022. The Bitcoin market always hits its all-time high on the Satoshimeter.

This tool highlights the pattern developed by Stockmoney Lizards. It allows us to conclude that the current market phase is not over yet. So a number of possible scenarios can be taken in to account for the growth of Bitcoin price before the next peak is reached.
 thecoinrepublic.com
