
With Bitcoin price sustaining above $60,000, bulls target the $66K level amid rate cut speculations.
As the BTC price rises above the $60,000 level, bullish sentiments are improving, with rising speculation of a potential rate cut in today’s FOMC meeting. The Bitcoin price currently trades at $60,236, with a minimal intraday move following yesterday’s 3.61% jump.
With the chances of a 500 basis point cut in interest rates, will Bitcoin’s head-and-shoulder pattern reach the $66,590 mark?
Bitcoin Recovery Teases $61K Break
With a recovery run in the 4-hour chart, the BTC price action shows an inverted head-and-shoulder pattern. The recovery run with the bullish pattern teases an uptrend in Bitcoin as the broader market sentiments are improving.
The bullish jump creates an engulfing candle in the daily chart, undermining the 3-day bearish pullback over the weekend and Monday.
The 4-hour chart’s recovery run and the bullish engulfing candle of the daily chart complete the right shoulder of an inverted head-and-shoulder pattern. As the minor pullback retests the bullish breakout, the uptrend chances with a post-retest reversal for Bitcoin increase.
Based on the Fibonacci levels of the daily chart, the next resistance level is the $61,613 support resistance level at 23.60%, with the target at $66,600.
Bitcoin ETFs Buy More
Supporting the bullish recovery, the Bitcoin ETF market witnesses a surge in inflows. Yesterday, the U.S. Spot Bitcoin ETF market registered the fourth consecutive bullish day with an inflow of $186 Million.
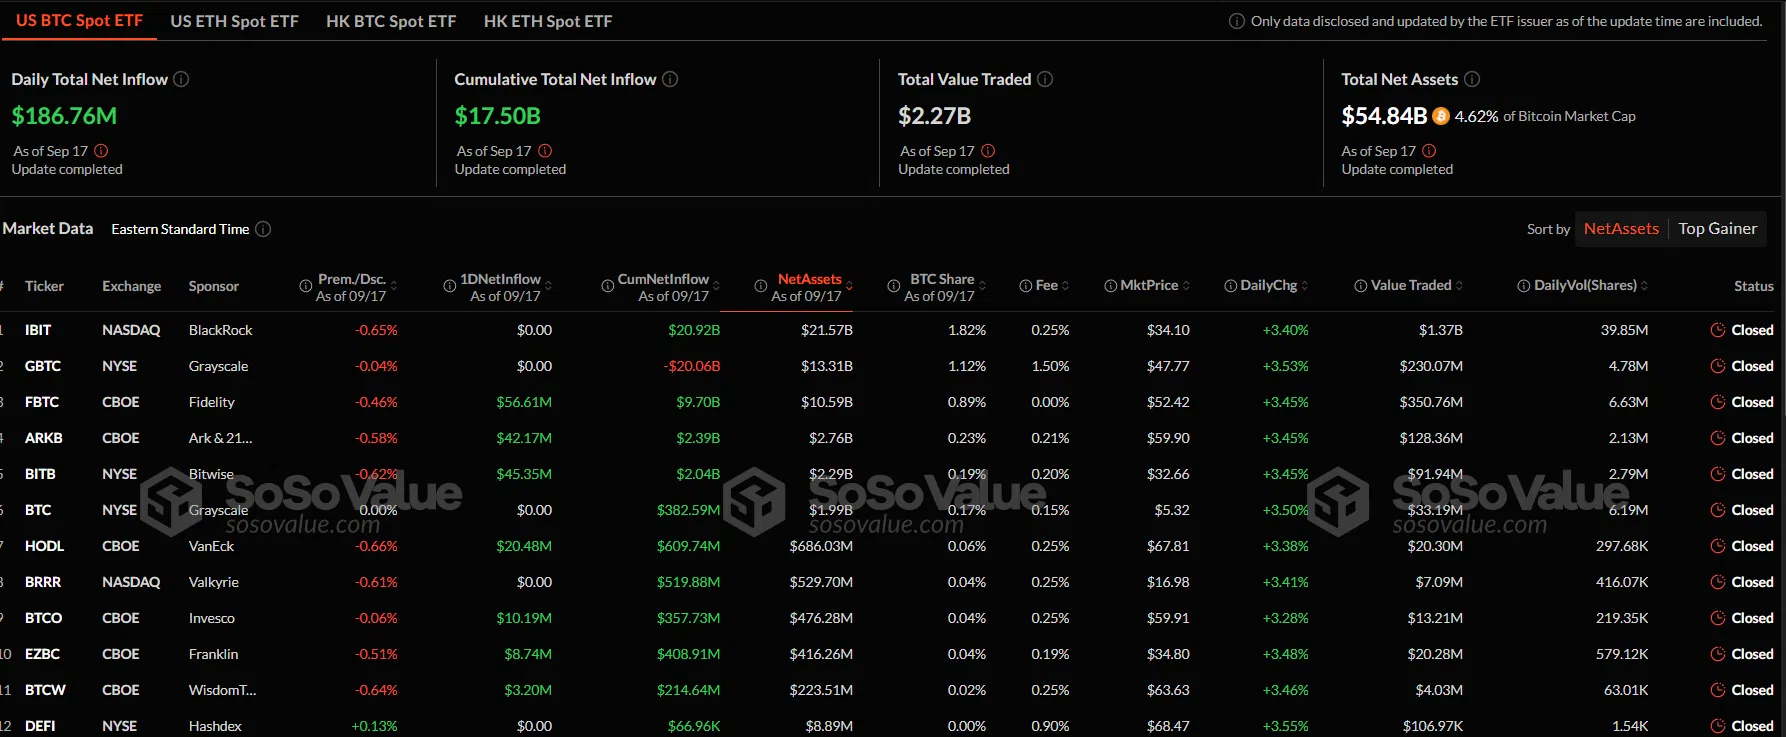
Amid the recovery day, Grayscale’s Spot Bitcoin ETF protects the Bitcoin held with zero flow. Further, the Bitwise and Fidelity ETFs fueled the growth with $45.4 million and $56.6 million inflows, respectively.
BTC Price Targets
Based on the price action levels of the 4-hour chart, the next resistance levels above the $61,451 ceiling are $64,596 and $66,590. Meanwhile, the base supports are at $60,000 psychological support, followed by the $57,681 horizontal level.
The MACD indicator in the 4-hour chart gives a bullish crossover with a surge in the positive histograms.