
As of Sept. 16, 2024, bitcoin traded at $58,578, within a 24-hour range of $58,231 to $60,366. The leading crypto asset saw a daily trade volume of $26.95 billion, with a market cap of $1.15 trillion. Despite this high liquidity, bitcoin is struggling to break key resistance levels, as technical indicators show mixed momentum.
Bitcoin
Bitcoin’s 1-hour chart reveals a clear downward trend, with prices sliding from $60,388 to $58,124. The lower highs and lows signal bearish momentum, though there have been some attempts at recovery near the $58,500 level. Unfortunately, low volume doesn’t suggest a strong reversal. Resistance lies between $60,000 and $60,300, while $58,000 stands as an essential psychological and technical support.
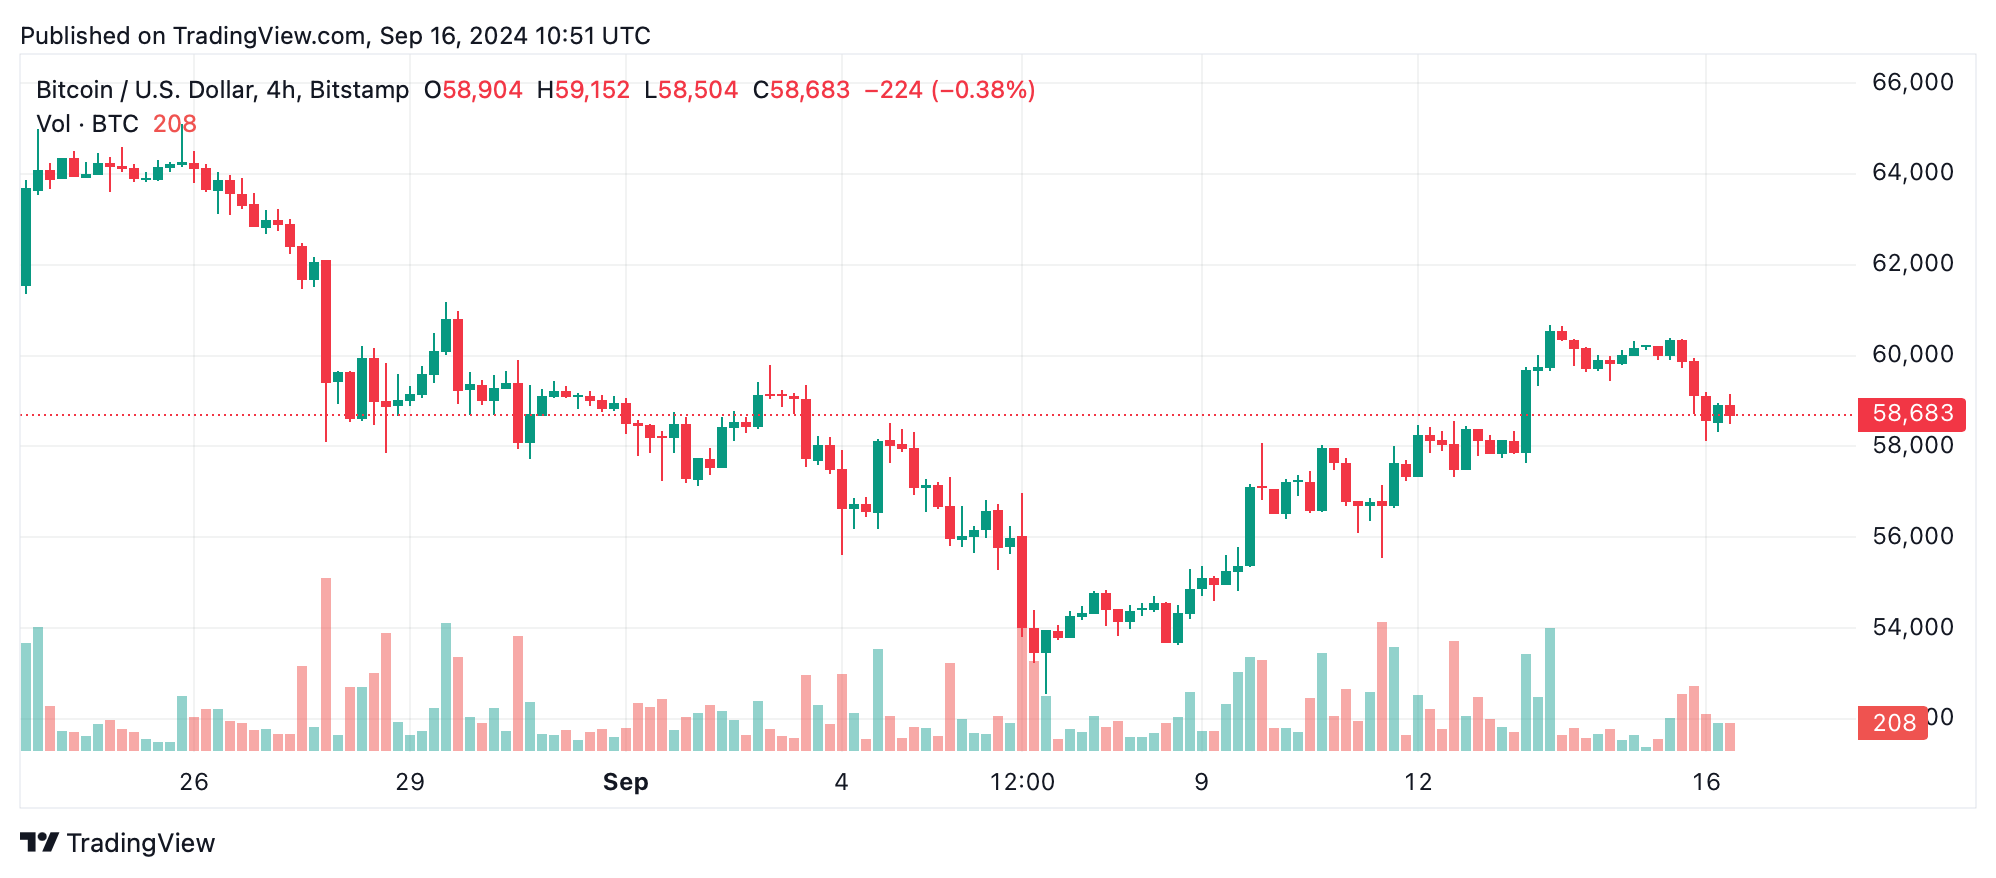
On the 4-hour chart, bitcoin’s recent dip from $60,670 has led to sideways trading, a sign of market indecision. While the volume is moderate, the lack of a significant rally points to weak momentum. Support at $58,000 mirrors the 1-hour and 4-hour charts, underscoring its importance. Meanwhile, resistance at $60,000 persists. If bitcoin can break above $59,000 with increasing volume, upward momentum might follow, though the current trend remains tilted to the downside.
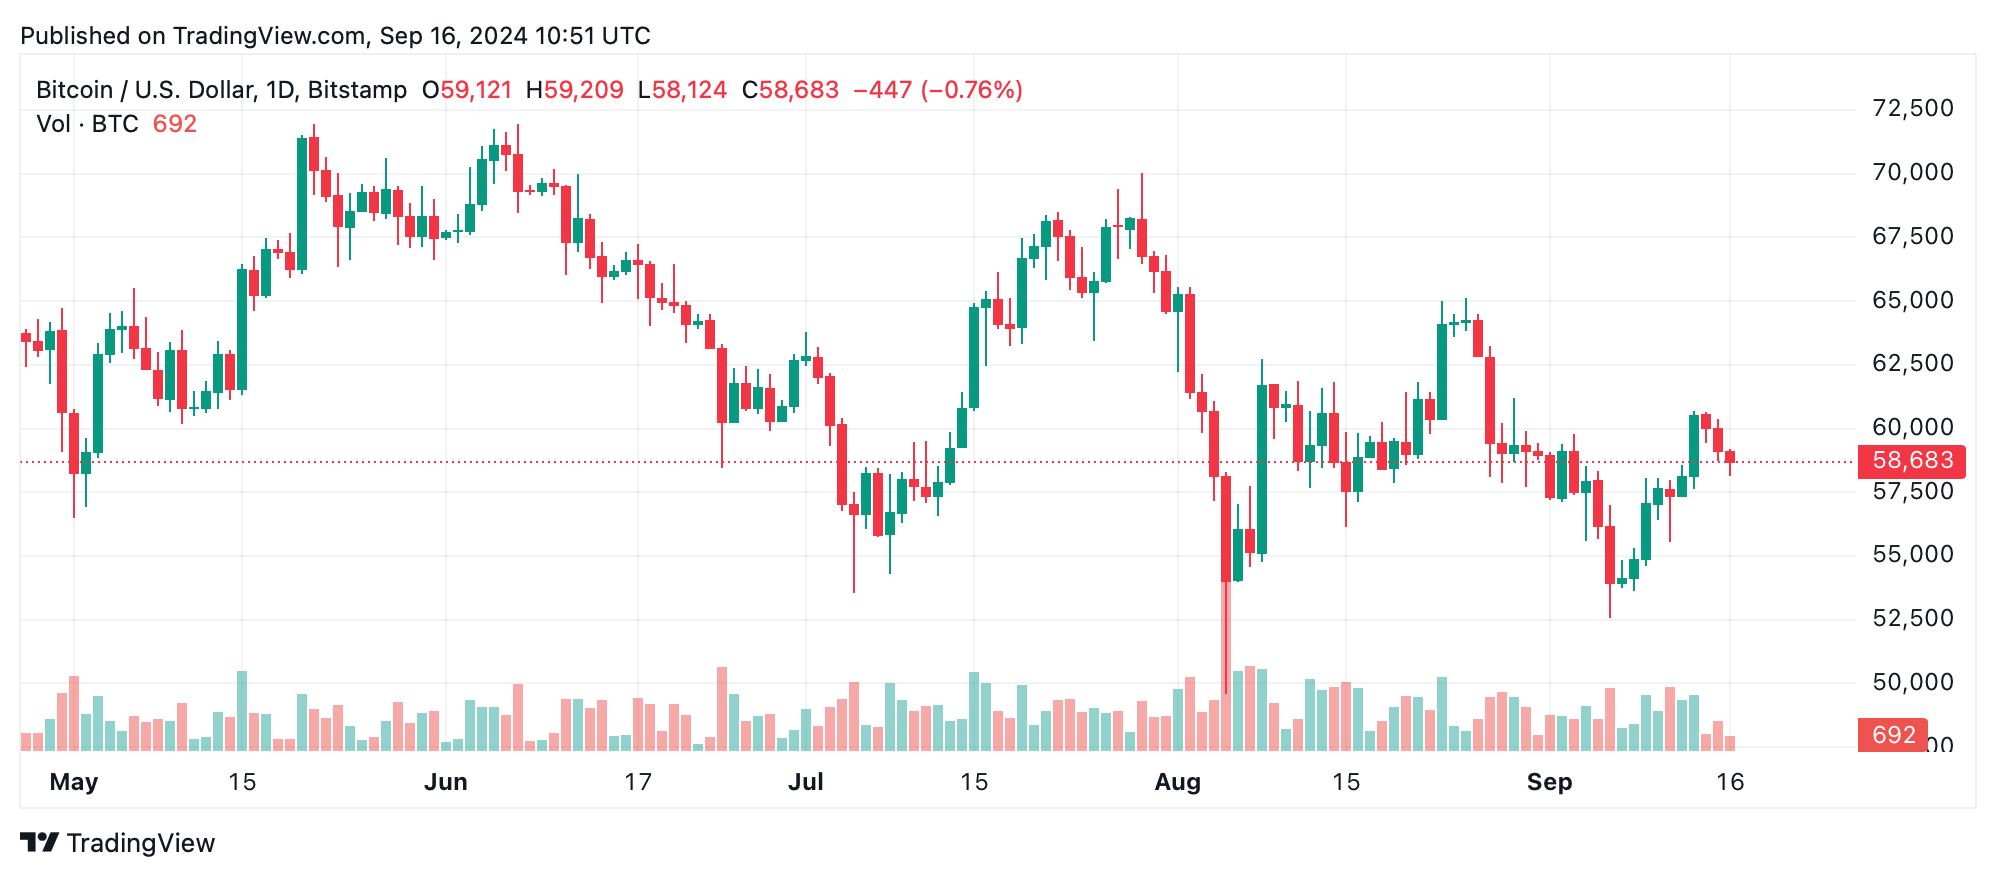
The daily chart highlights a broader downtrend, stretching from a local high of $65,103 and bottoming around $52,546 before making a recovery attempt. The $60,000 mark remains a tough barrier, and recent action shows lower highs, suggesting more potential losses without a surge in momentum. A solid support at $55,000 acts as a safety net, but buyer confidence has been notably lacking.
Looking at oscillators, the relative strength index (RSI) sits at a neutral 50, reflecting indecision. Stochastic at 82 signals that overbought conditions could limit short-term gains. However, momentum indicators like the awesome oscillator and momentum flash some bullish signals, hinting at a possible short-term bounce if the right conditions arise.
Moving averages (MAs) offer a mixed outlook. Short-term averages like the 10-day and 20-day exponential moving averages (EMAs) lean toward bullish optimism but longer-term averages, particularly the 50-day and 200-day, show bearish signals. This split indicates that while short-term gains are possible, bitcoin remains at risk of further losses unless stronger buying power emerges.
Bull Verdict:
Despite the current challenges, bitcoin’s short-term MAs and momentum indicators suggest there may be room for a short-term bounce. If the price breaks above $59,000 with increasing volume, bitcoin could reclaim the $60,000 mark, providing a favorable entry for bullish traders. The long-term trend, however, will depend on sustained buying pressure and a confirmed break above key resistance levels.
Bear Verdict:
Bitcoin’s failure to break above $60,000, coupled with weak volume and lower highs across multiple timeframes, indicates potential for further downside. Longer-term moving averages signal bearish momentum, and if the price dips below the $58,000 support level, a deeper correction toward $55,000 or lower is likely. Without a significant reversal in volume, bearish traders may gain the upper hand