A popular crypto analyst thinks three indicators suggest Bitcoin (BTC) is far from its top.
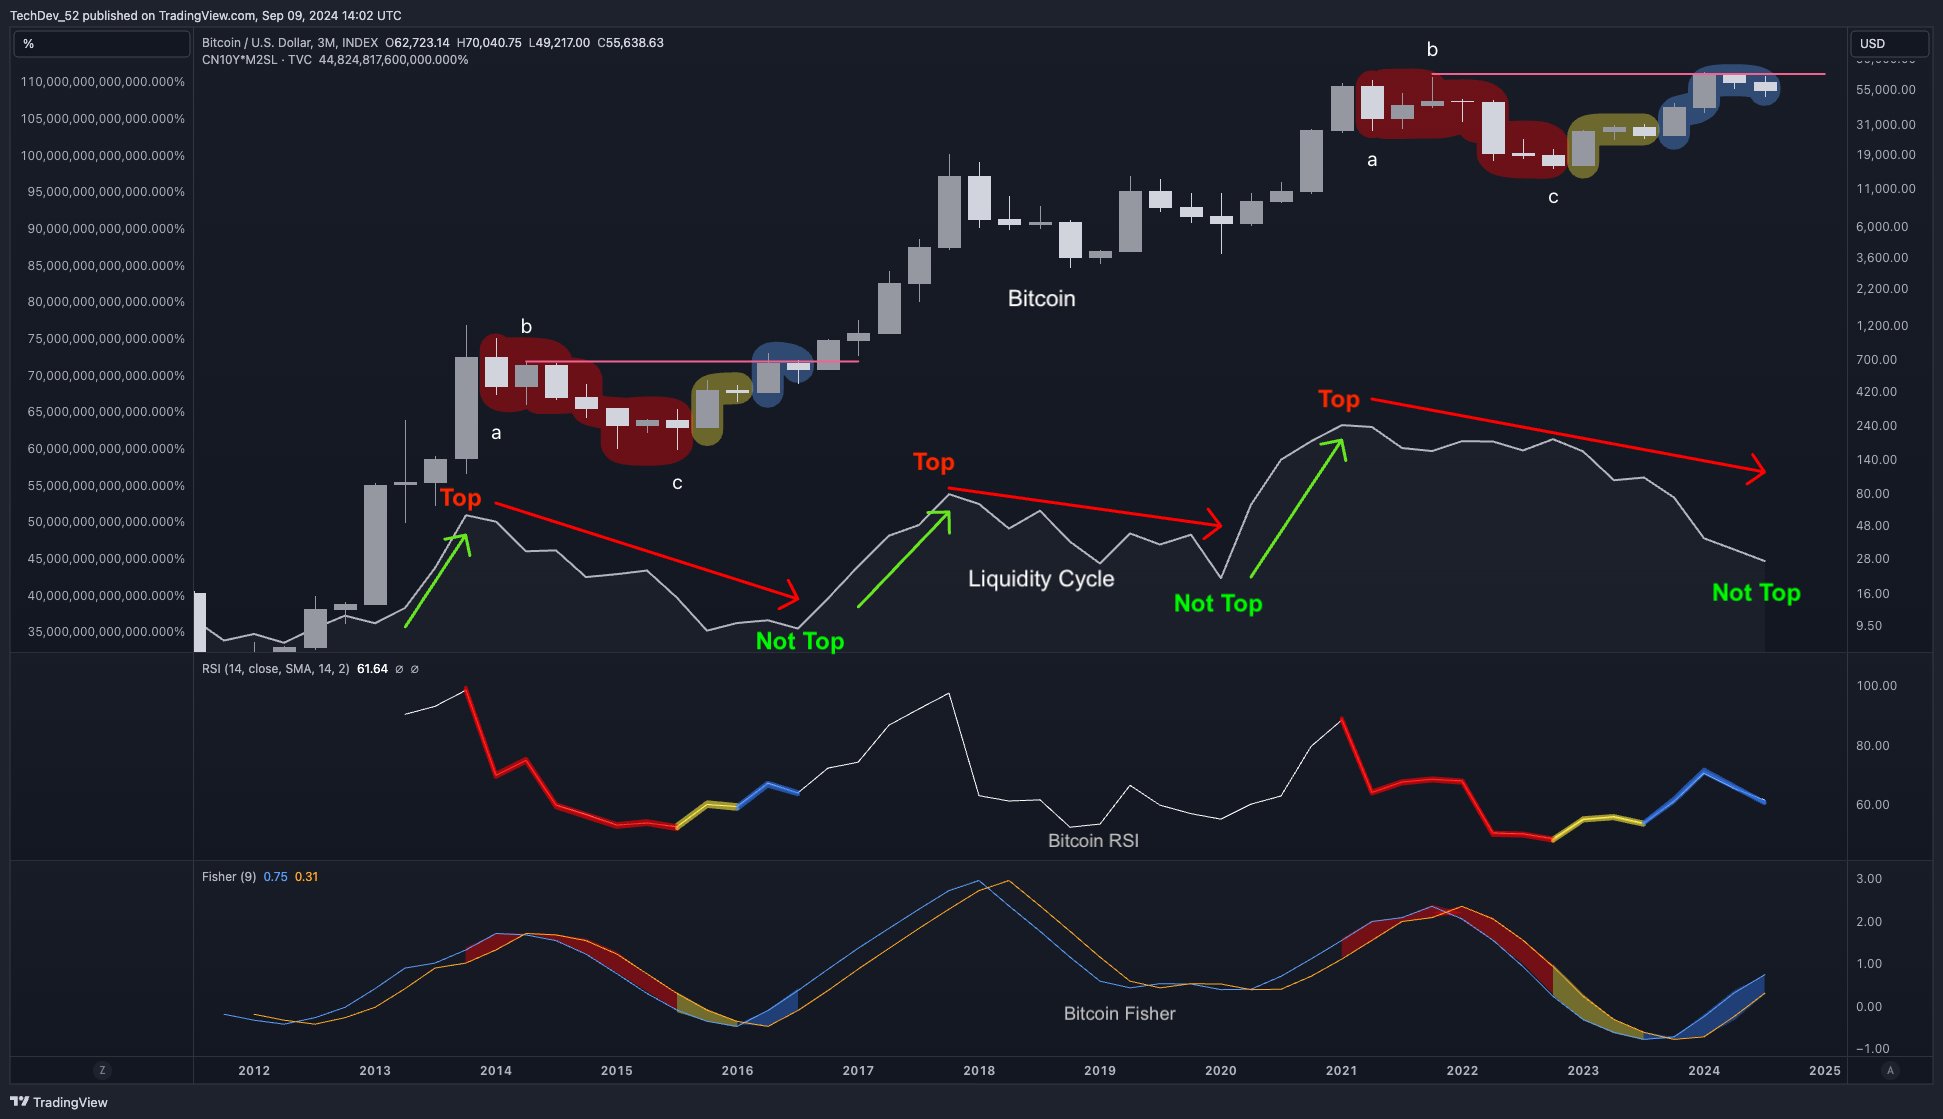
The pseudonymous crypto trader known as TechDev shares a graphic with his 468,700 followers on the social media platform X that charts the liquidity cycle, Bitcoin’s Relative Strength Index (RSI) and BTC’s Fisher Transform Indicator.

TechDev’s first chart displays a line for Bitcoin’s price and a line that pits the Chinese 10-year bonds (CN10Y) against M2SL, the seasonally adjusted measure of money supply in the United States.
Based on the trader’s chart, he appears to suggest that an expansion in the CN10Y against M2SL could trigger big Bitcoin rallies.
The RSI indicator is a momentum oscillator used to determine whether an asset is oversold or overbought. The RSI’s values range from zero to 100 with the level between 70 to 100 indicating that an asset is overbought while the zero to 30 level indicates that an asset is oversold.
TechDev also charts Bitcoin’s Fisher Transform indicator to pinpoint trend reversals.
The analyst’s graphic suggests that both the RSI and the Fisher Transform indicator are demonstrating patterns that look similar to patterns preceding BTC’s massive 2017 bull run.
Bitcoin is trading at $57,793 at time of writing.
Generated Image: Midjourney
 dailyhodl.com
