
Bitcoin faces mounting pressure as crucial indicators signal a potential drop to the $53,541 mark. With sellers gaining momentum and technical charts flashing red, the cryptocurrency is struggling to find a foothold in a volatile market.
Traders are watching closely to see if the bearish trend will continue or if a reversal is on the horizon as $BTC hovers near critical support levels. The next few days could be crucial in determining Bitcoin’s short-term trajectory.
As Bitcoin faces increasing selling pressure, this article explores the recent bearish signals affecting its price movement, analyzing key technical indicators that suggest a potential drop to $53,541. By examining the critical support levels to watch, insights into whether $BTC will find stability or continue its slide will be provided.
As of the time of writing, Bitcoin was trading at approximately $56,691, reflecting a 4.04% decline with a market capitalization exceeding $1 trillion and a trading volume surpassing $31 billion. Over the past 24 hours, $BTC’s market cap has dropped by 3.96%, while trading volume has surged by 22.55%.
Analyzing $BTC’s Recent Price Action And Key Indicators
On the 4-hour chart, Bitcoin has displayed strong bearish momentum below the 100-day Simple Moving Average (SMA) following its failure to break above the $60,152 mark. The price is now attempting to fall toward the $53,541 mark. If the cryptocurrency successfully breaches this key level, it could begin a more pronounced downtrend, potentially driving the price down to other crucial support levels.
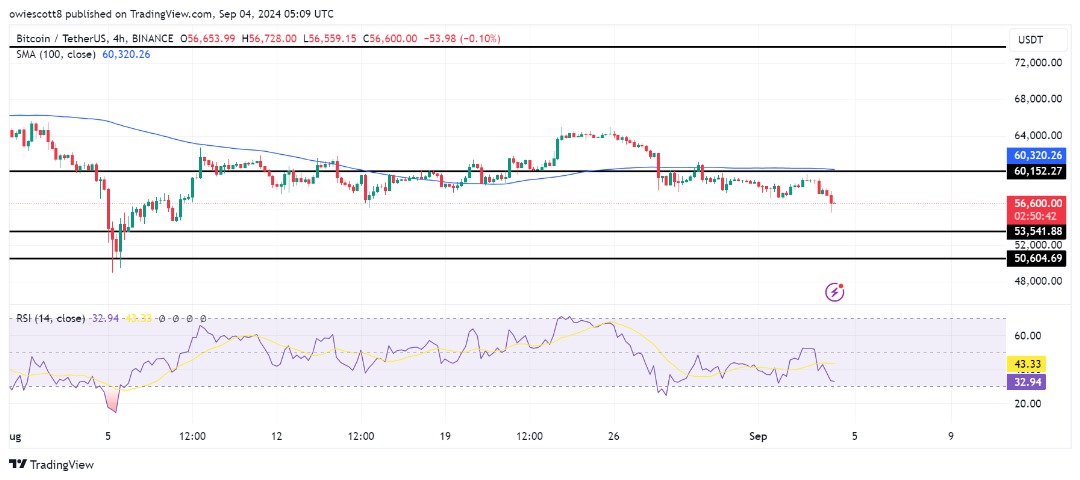
Additionally, on the 4-hour chart, the Relative Strength Index (RSI) has slipped below the 50% mark, currently resting at 32%. This decline highlights growing bearish momentum and suggests that selling pressure could intensify.
On the daily chart, $BTC is showing significant negative movement below the 100-day SMA by printing two bearish momentum candlesticks. This downbeat surge reflects strong selling pressure and negative market sentiment, increasing the likelihood of $BTC reaching the $53,541 mark soon.
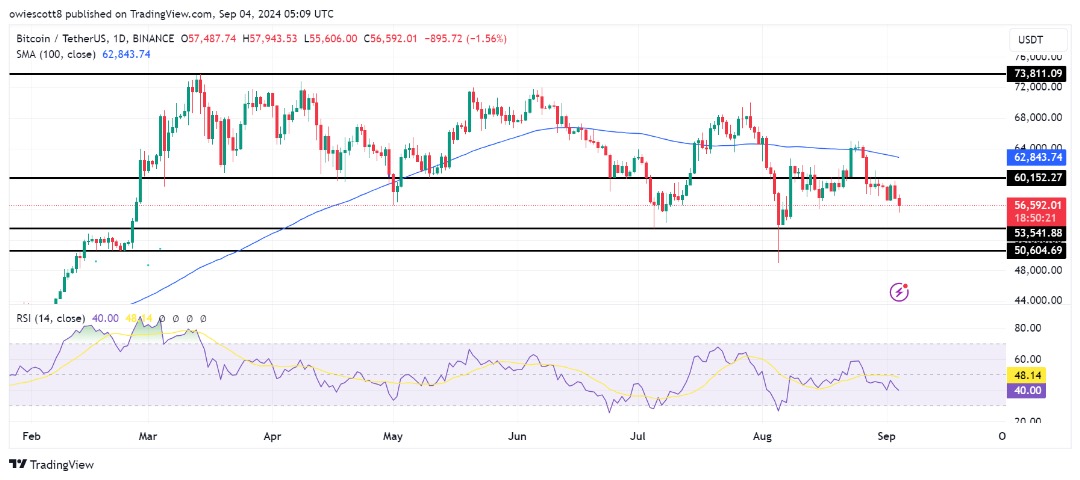
Finally, the 1-day RSI shows that bearish pressure on $BTC is intensifying. The signal line has recently dropped below 50%, now resting at 39%, which also signals growing selling pressure and a pessimistic sentiment for the digital asset.
Investor Outlook: Preparing For Bitcoin Potential Downside
With bearish pressure mounting and key indicators pointing to further declines, Bitcoin appears poised to drop to the $53,541 mark. Should the cryptocurrency breach this level, it could signal a more significant pessimistic move, potentially driving the price down to the next support at $50,604 and beyond.
However, if Bitcoin hits the $53,541 support level and the bulls manage to stage a comeback, the price could start moving upward toward the $60,152 resistance mark. A successful breach of this resistance might lead $BTC to test its all-time high of $73,811, with the potential to set a new record if it surpasses this level.