Bitcoin’s (BTC) price could face a prolonged decline after failing to break above the $60,000 mark. This struggle to maintain a key resistance level has raised concerns among investors, who are now closely watching how far the downturn might extend.
Currently, Bitcoin is trading at $57,862, marking a 6.85% drop over the past seven days. While some market participants might be hoping for a recovery, on-chain analysis suggests that another price decrease could be on the horizon.
Bitcoin Market Condition Worsens
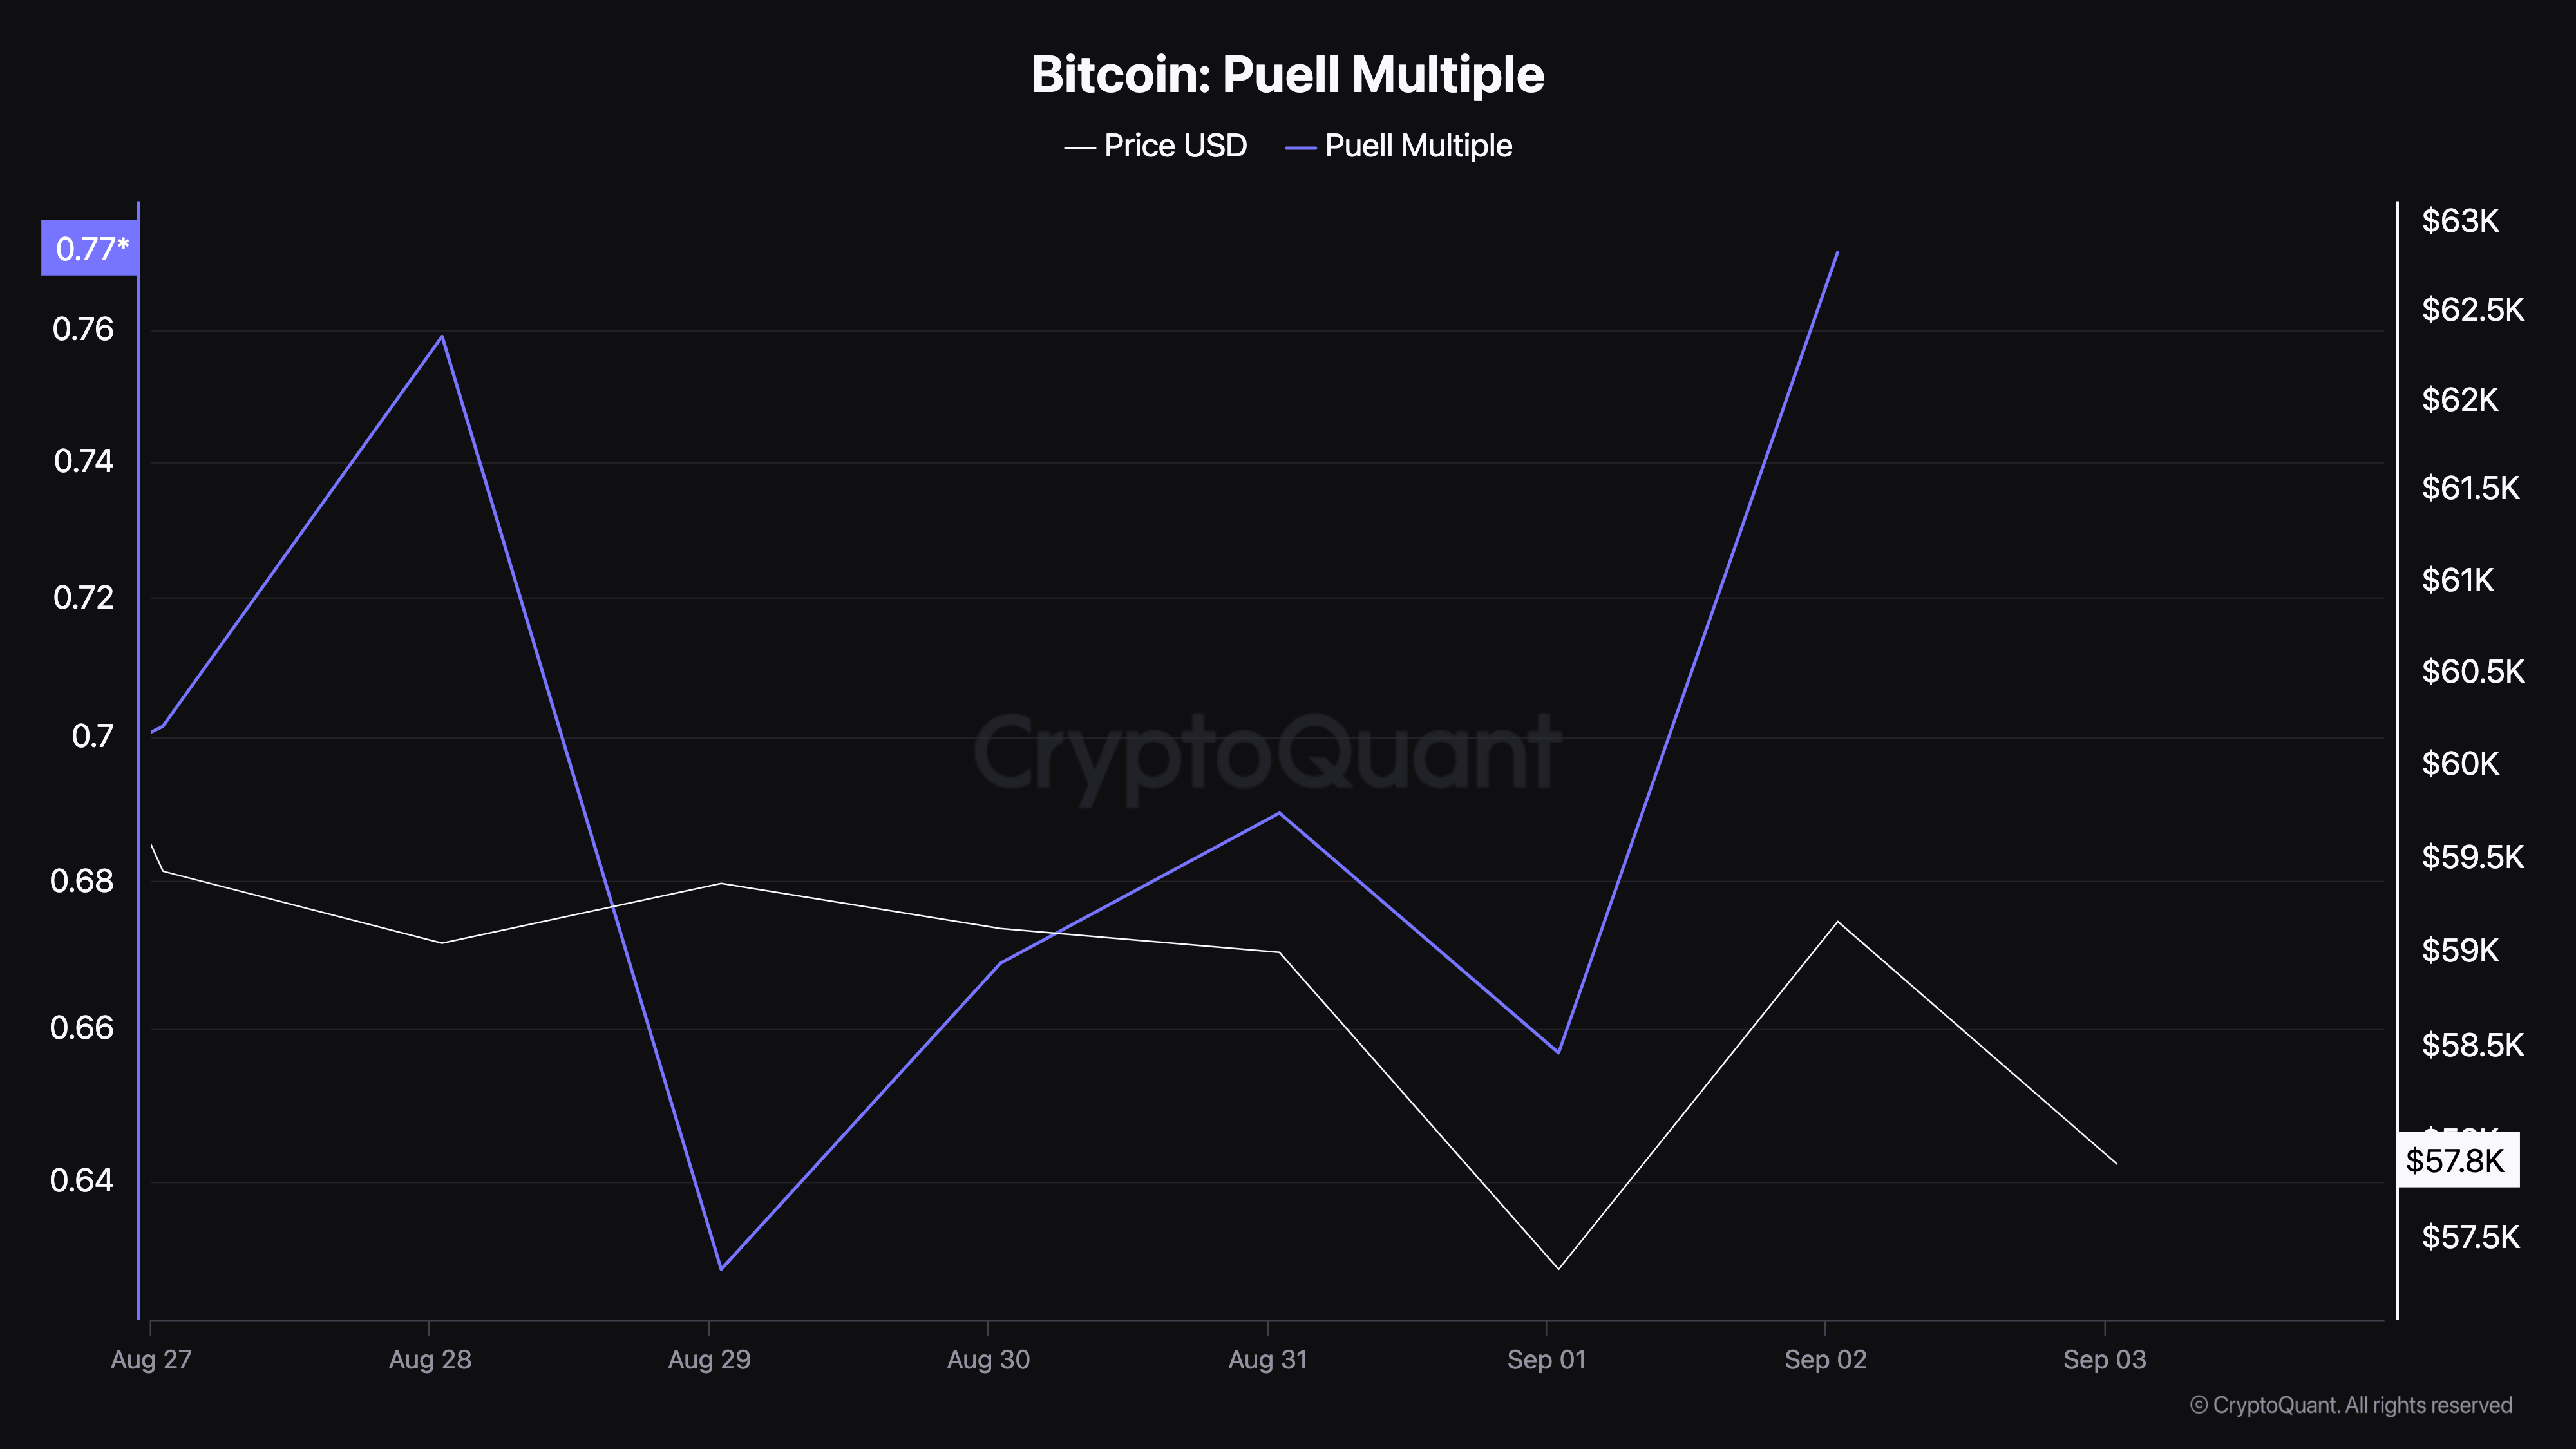
One key on-chain indicator supporting the potential for further decline is Bitcoin’s Puell Multiple. This metric compares the daily issuance of coins to the yearly average, providing insights into whether the price is near a local top or bottom.
High Puell Multiple values suggest the price is close to a local top, while low values indicate proximity to a bottom. According to CryptoQuant, Bitcoin’s Puell Multiple stood at 0.65 on September 1.
Today, the reading has risen to 0.77. This increase suggests that Bitcoin may have reached a local top, indicating a possible further decline in price.
Read more: Where To Trade Bitcoin Futures: A Comprehensive Guide

In addition to the Puell Multiple, the In/Out of Money Around Price (IOMAP) indicator also supports the possibility of a further decline in Bitcoin’s price. The IOMAP analyzes addresses based on whether they are in profit, at a loss, or at the breakeven point at the current price.
If a larger number of addresses accumulated Bitcoin at a price lower than the current price, this could indicate strong support. Conversely, if more addresses bought BTC at a higher value, it suggests significant resistance.
According to data from IntoTheBlock, the number of addresses that purchased Bitcoin between $58,073 and $66,773 exceeds those who bought between $49,300 and $56,200. This suggests that Bitcoin might face strong resistance at higher prices. If buying pressure does not increase, the next potential price level for BTC could be around $54,520.

BTC Price Prediction: $54,000 Might Be Next
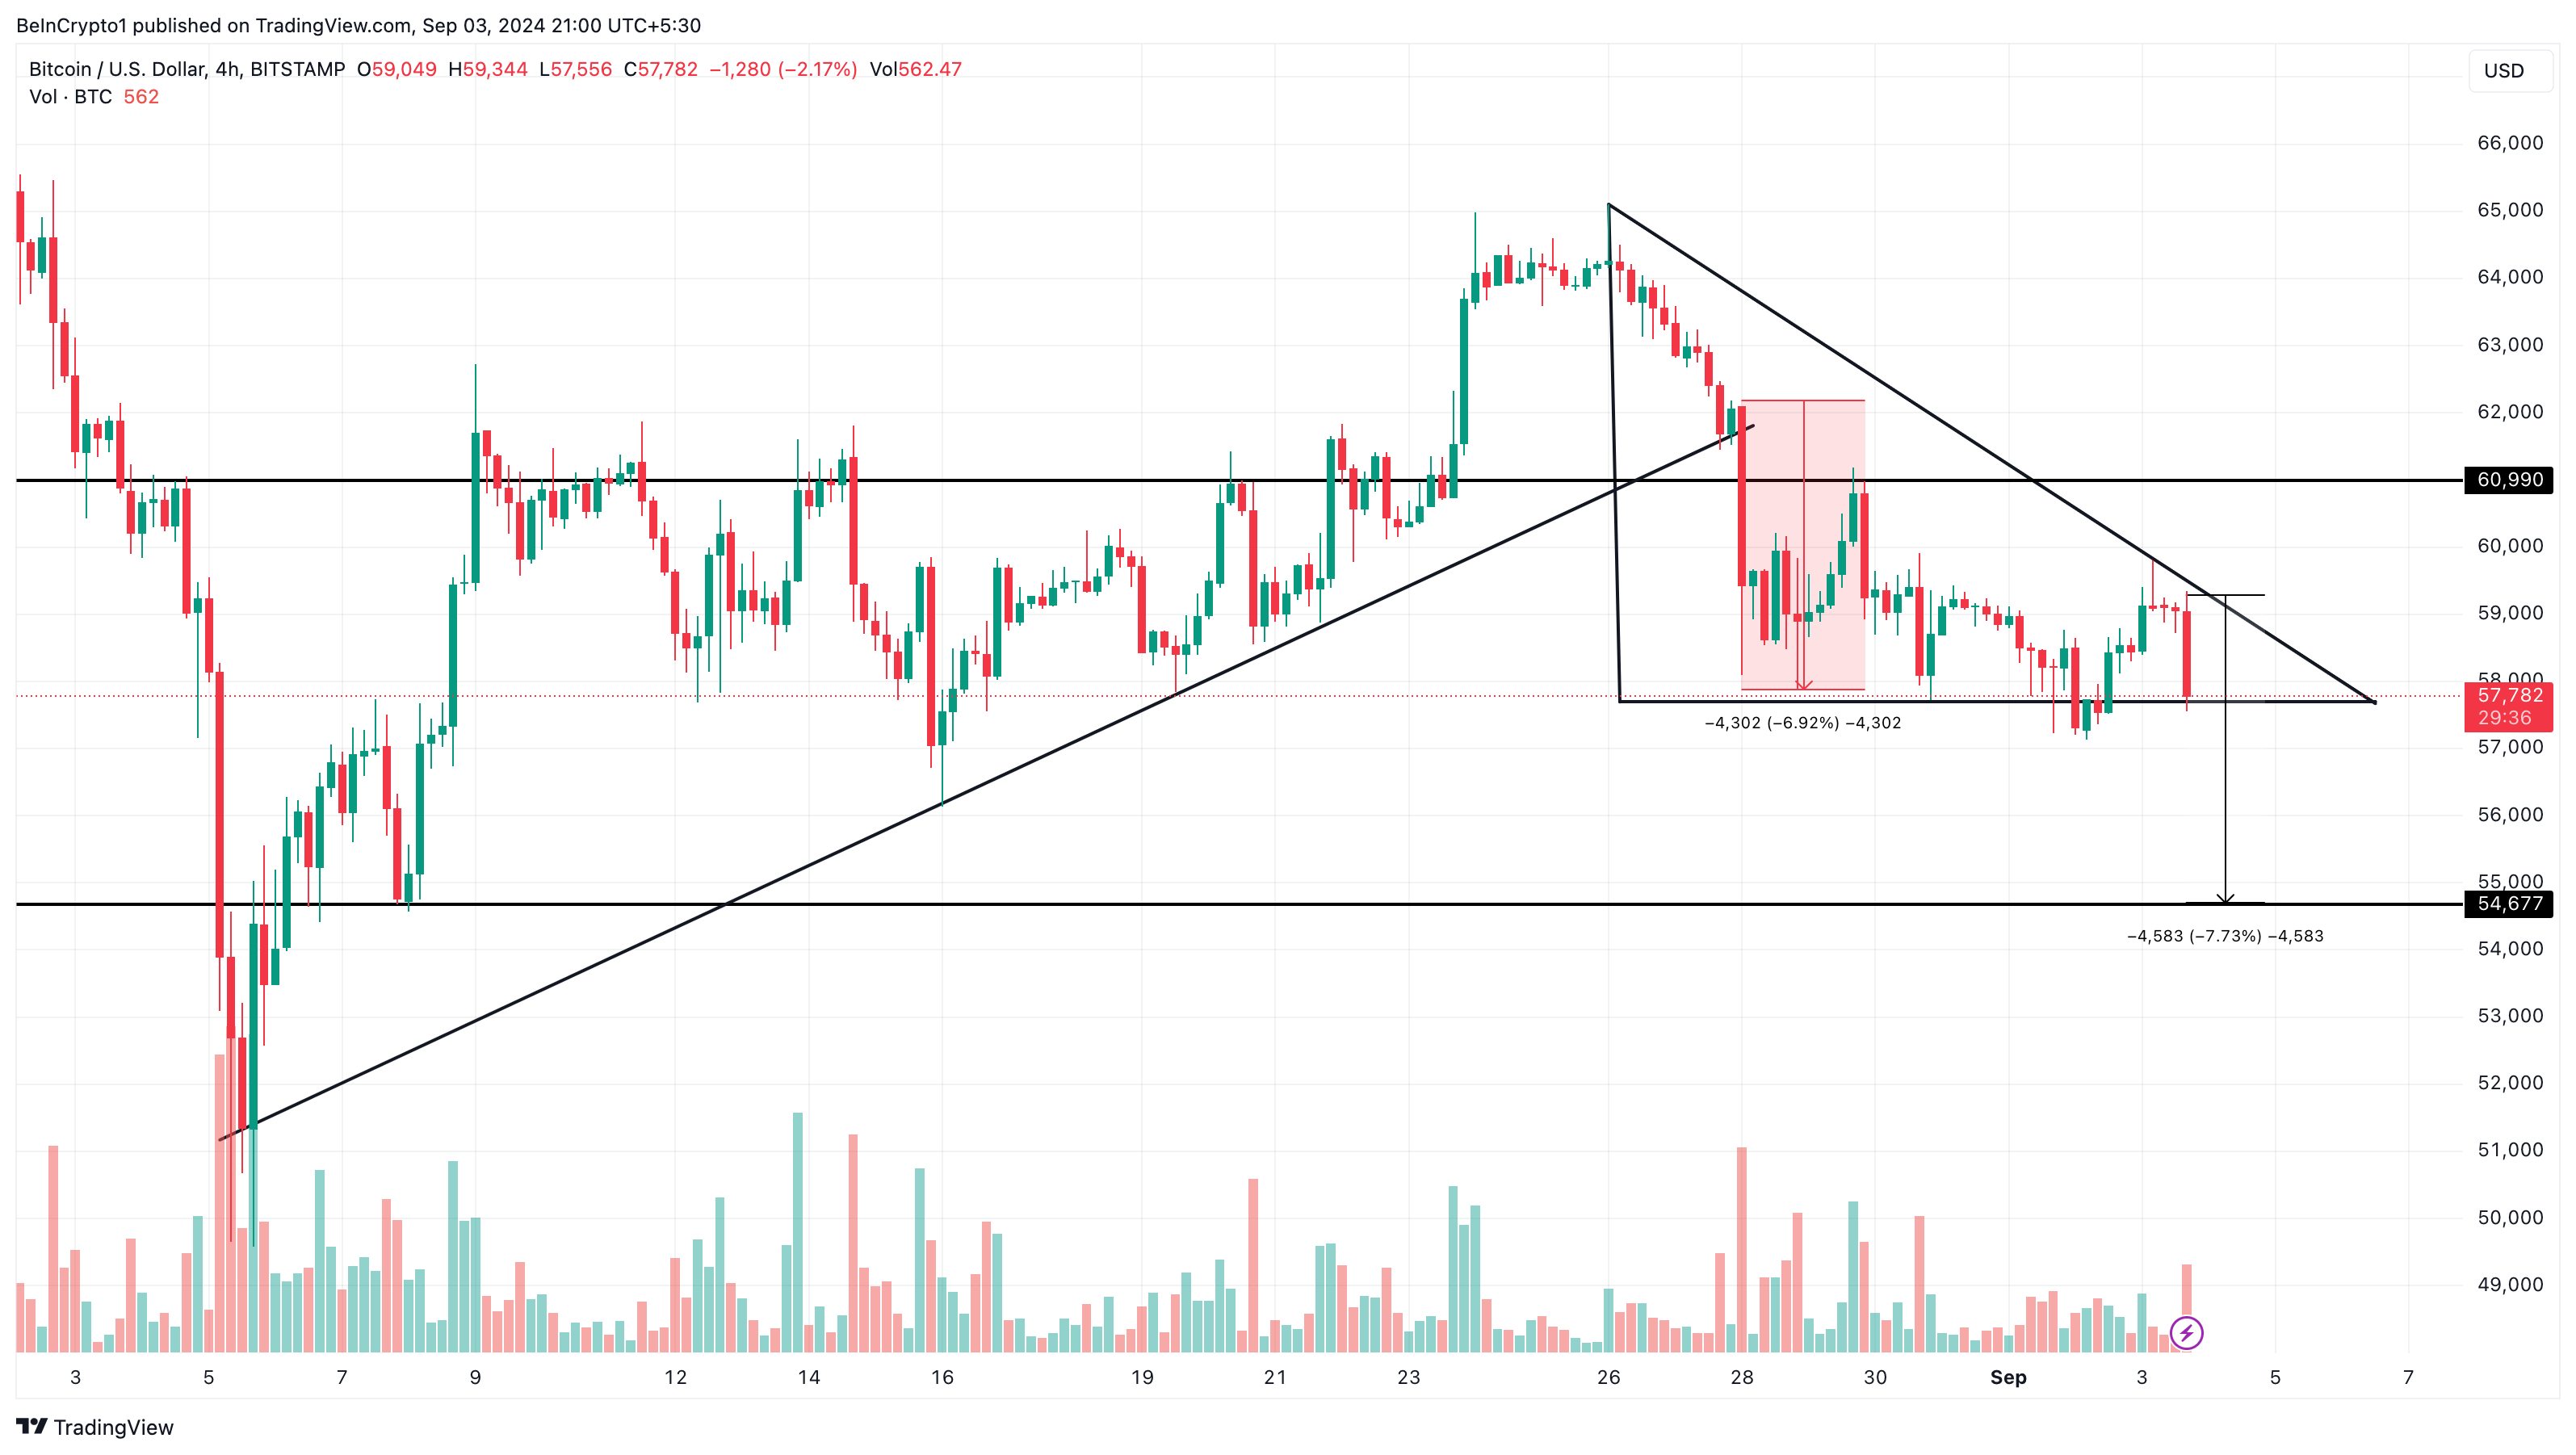
From a technical standpoint, Bitcoin’s 4-hour chart reveals the formation of a descending triangle, a bearish pattern that often signals the continuation of a downtrend. Previously, Bitcoin had formed an ascending triangle, which could have indicated an upswing, but the bullish scenario was invalidated when the price plunged from $62,000.
Given the current conditions, Bitcoin may struggle to recover, as previously discussed. If the downtrend continues, BTC could drop by another 7%, reaching approximately $54,677.
Read more: Bitcoin (BTC) Price Prediction 2024/2025/2030

However, if buying pressure intensifies or crypto whales start purchasing more BTC, the price might rally to $60,990. If the current trend persists, though, the decline could extend further.
 beincrypto.com
