Bitcoin’s price has finally found support and is demonstrating a rapid recovery. Yet, there is still one major obstacle it needs to break through.
Technical Analysis
By TradingRage
The Daily Chart
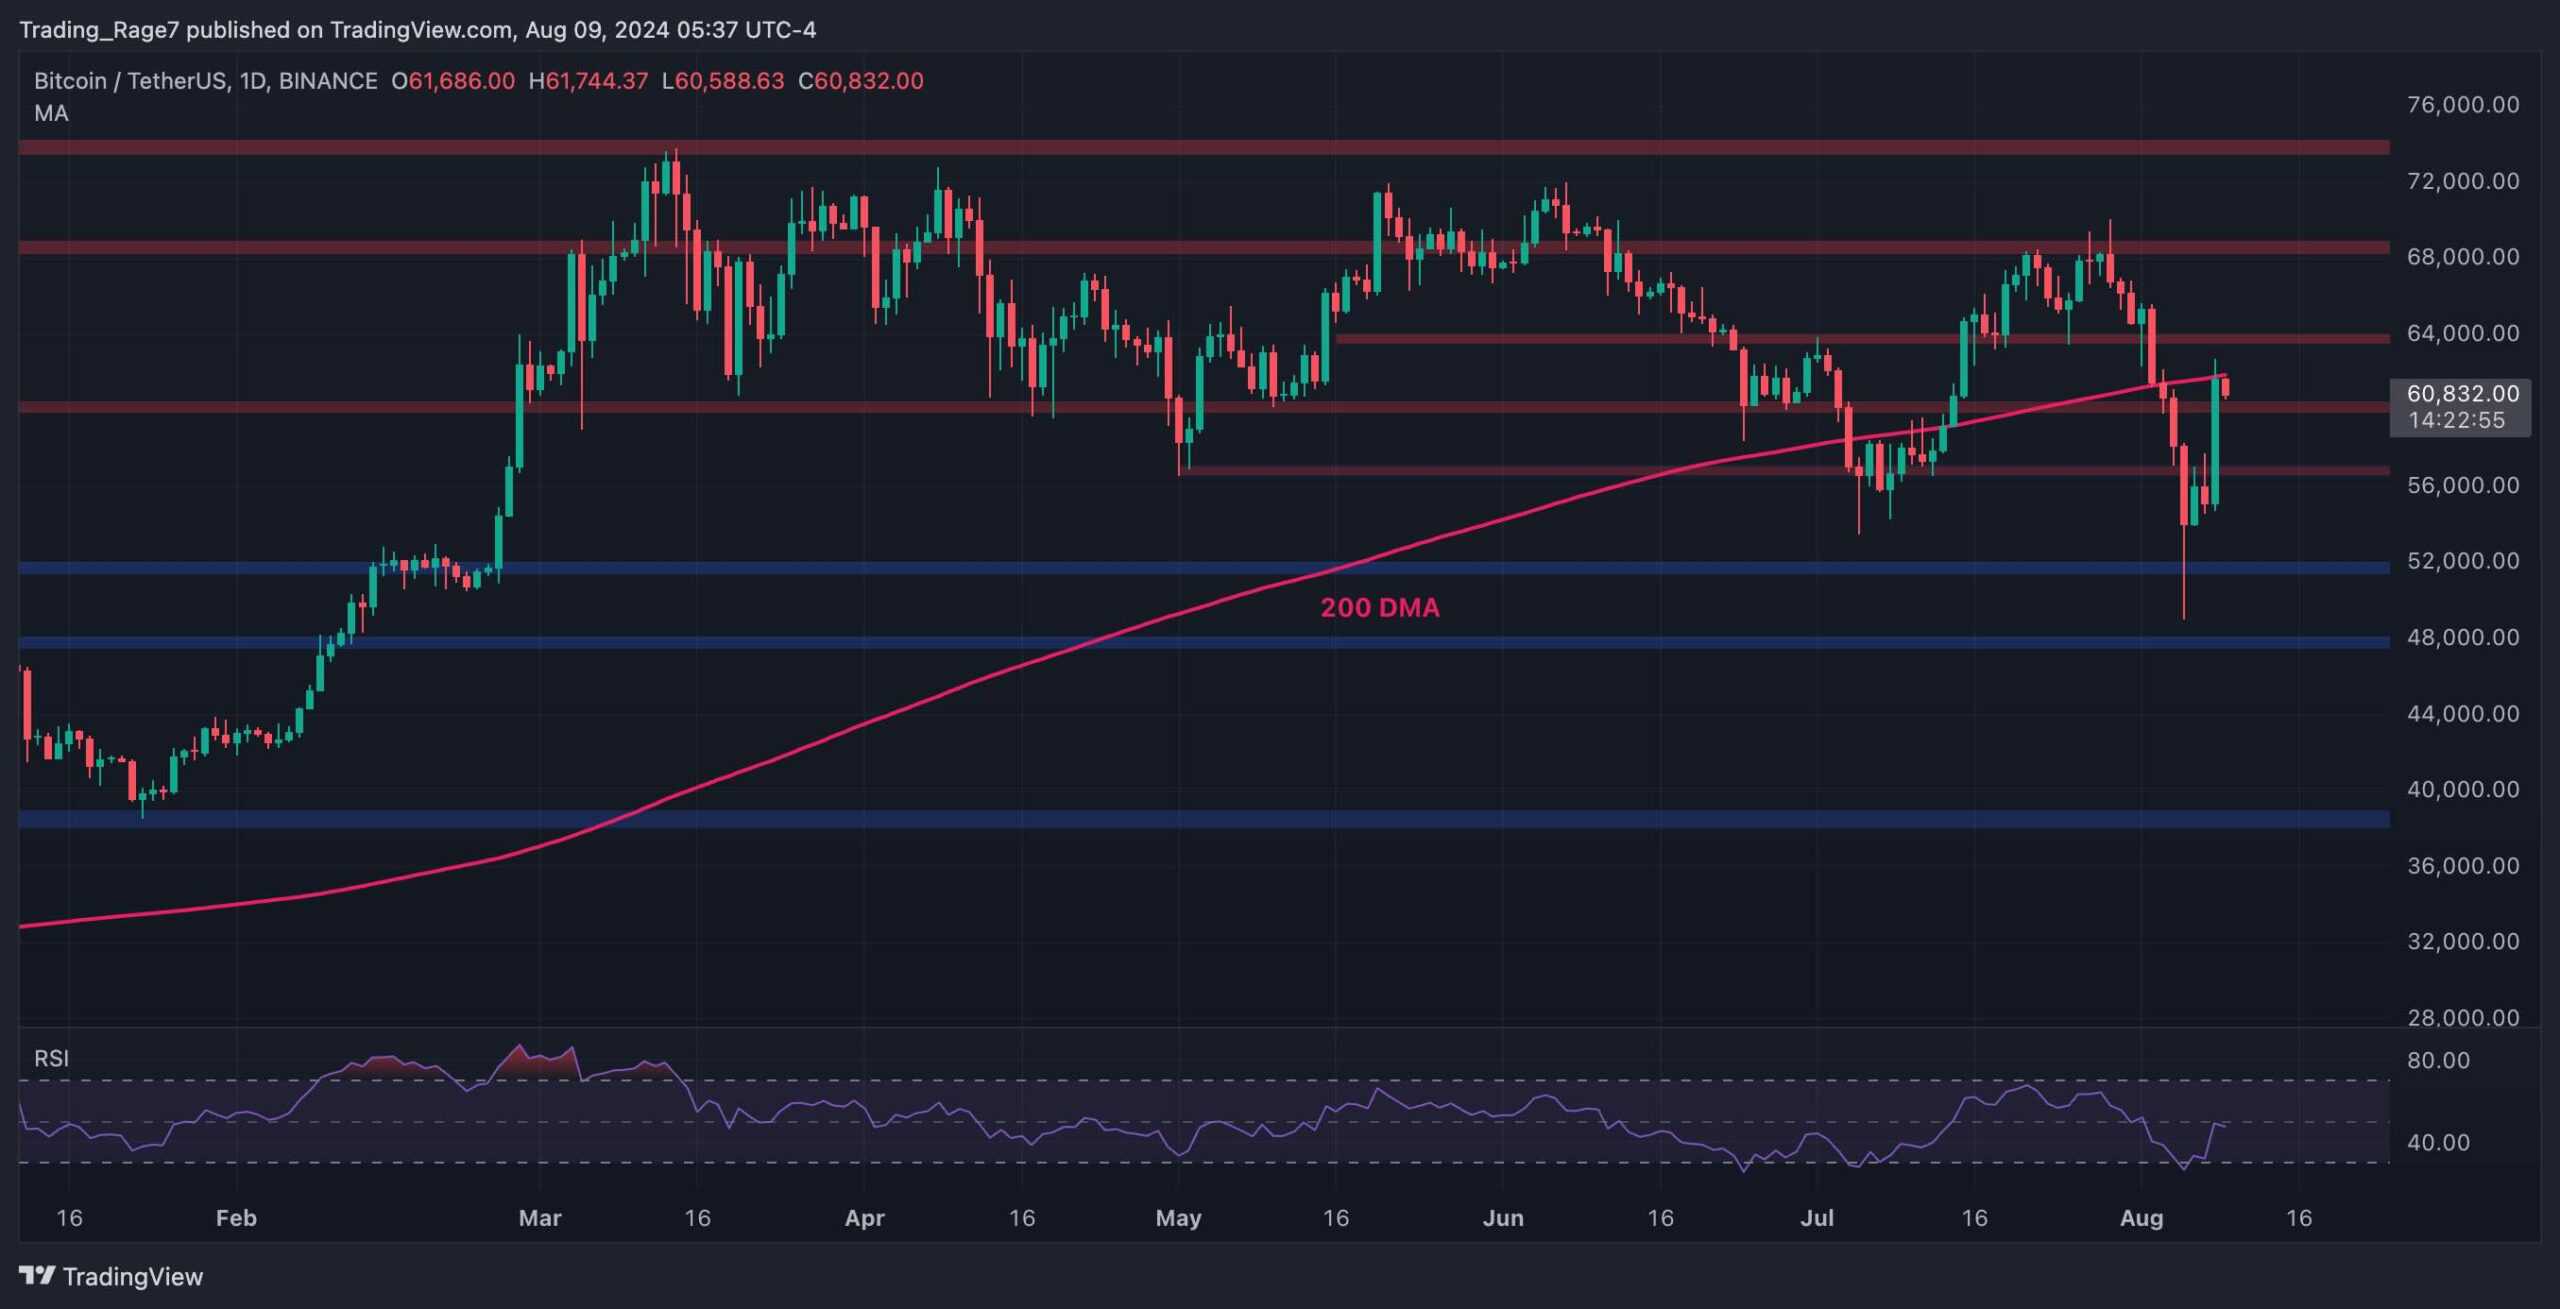
On the daily chart, the BTC price has experienced a massive drop since getting rejected from the $68K resistance level.
However, the decline has come to a halt at around the $50K mark, and the market has since spiked back above the $60K resistance level.
Currently, the price is testing the 200-day moving average, which is located around $61K. For BTC to continue its bull run, the 200-day moving average must be broken to the upside, as it is a key trend indicator.

The 4-Hour Chart
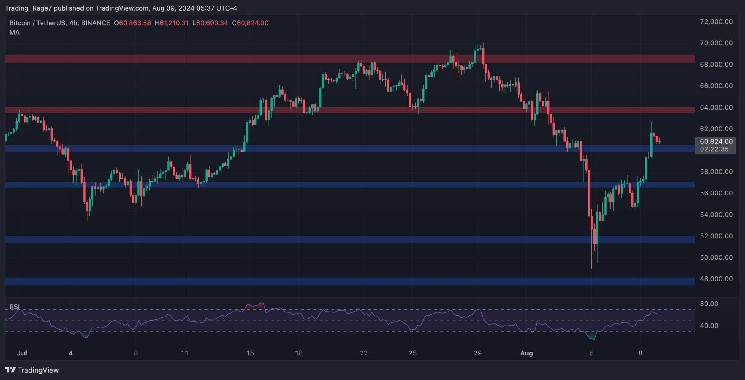
Looking at the 4-hour timeframe, the price has been making higher highs and lows since its V-shaped recovery from the $50K region.
The market has reclaimed both $57K and $60K. Yet, the breakout above $60K could be a fake one if the market quickly drops back below. If not, the $64K resistance level would be the next target for BTC as it would likely continue toward a new all-time high.

Sentiment Analysis
By TradingRage
Bitcoin Funding Rates
The Futures market has had a massive role in BTC’s short-term price action in recent months, and the last few weeks have been no exception. Therefore, analyzing the futures market sentiment can be very beneficial.
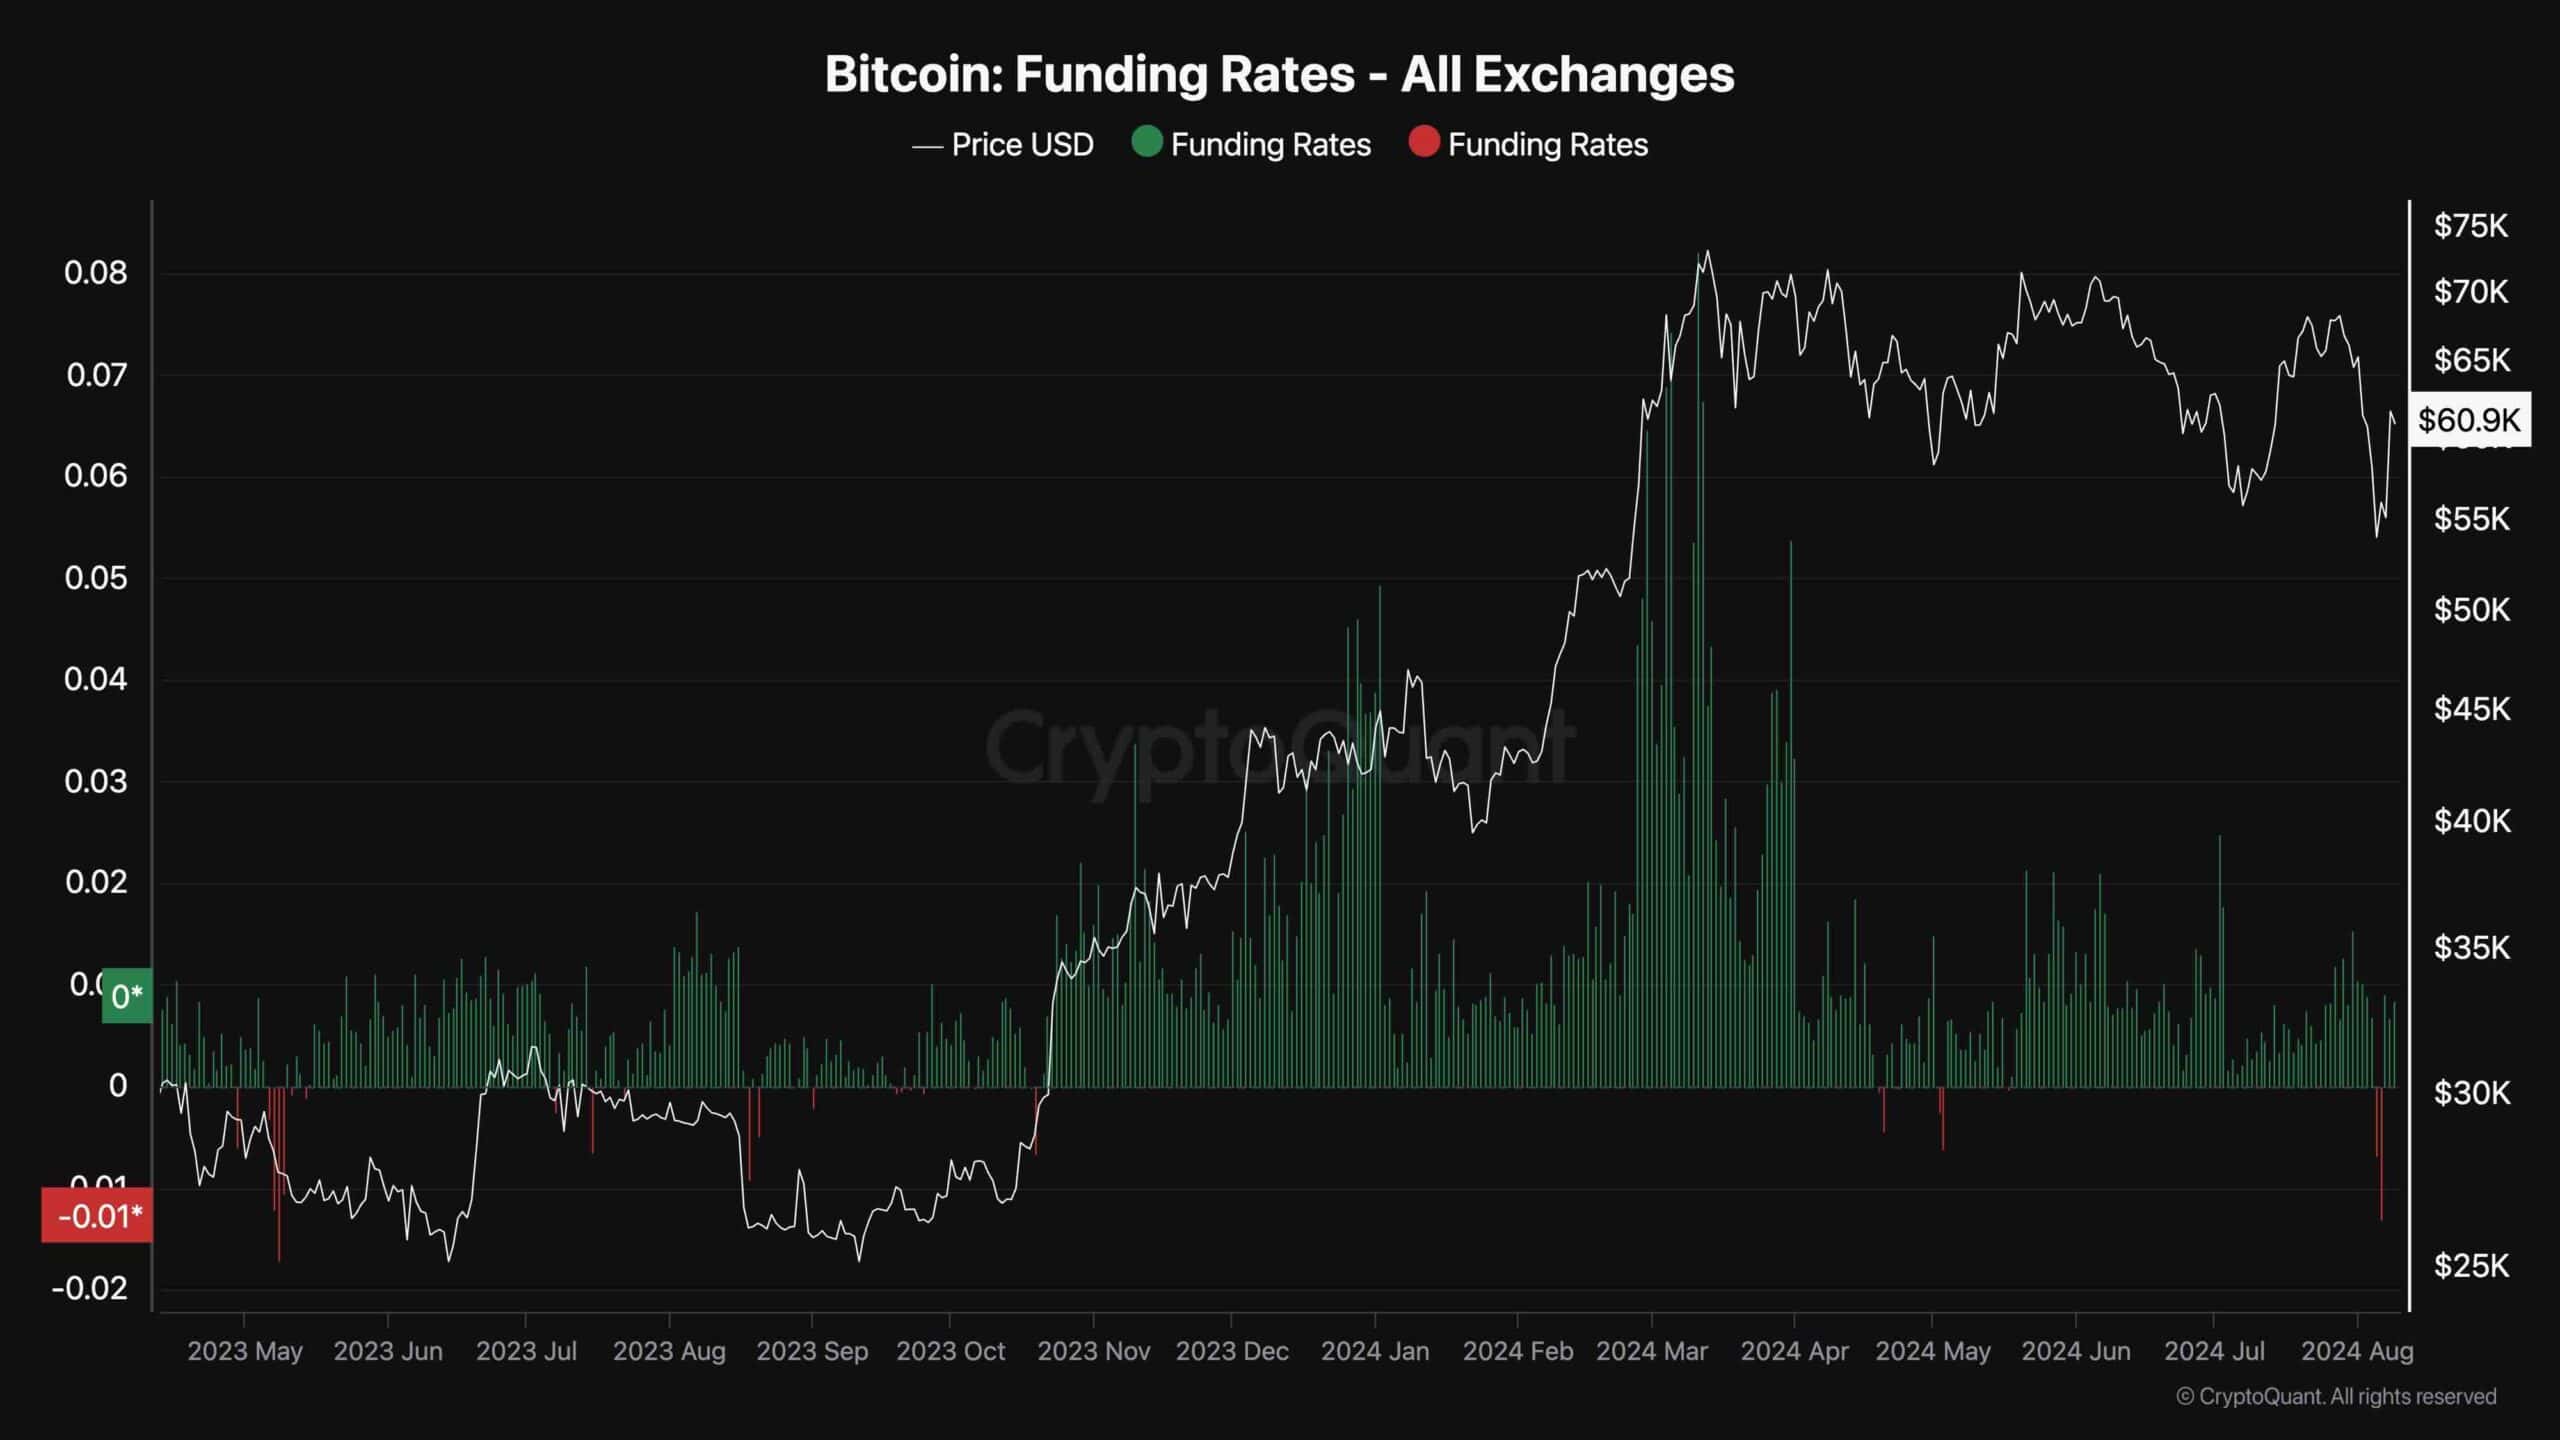
This chart demonstrates the Bitcoin Funding Rates metric, which measures whether the buyers or the sellers are more aggressive in executing their orders. Positive values indicate bullish sentiment and negative values are associated with bearish sentiment.
As the chart suggests, during the recent price drop, the funding rates have demonstrated significantly negative values. However, with the price’s recovery, the funding rates have returned to the positive region. This is a classic bottom pattern, which could indicate a price recovery. However, there are lots of other parameters, and this signal cannot be relied upon alone.

 cryptopotato.com