Bitcoin’s price has been correcting over the last couple of days after failing to break the $68K resistance level to the upside.
However, there is still a high probability of a new record high in the coming weeks.
Technical Analysis
By TradingRage
The Daily Chart
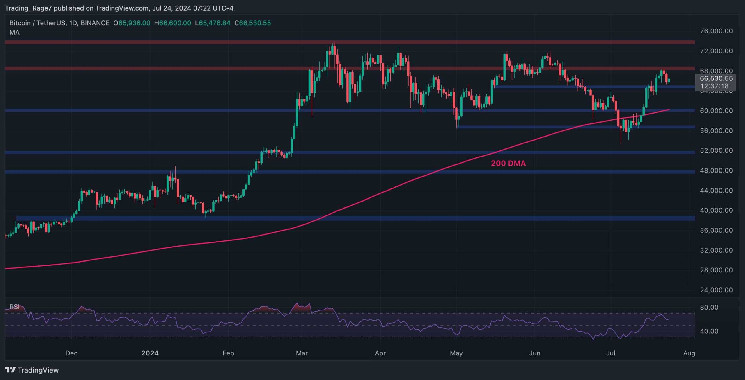
On the daily chart, the price has been rallying aggressively since its recovery from $56K. Meanwhile, the $68K mark has prevented the market from climbing higher, and a short-term pullback toward $65K has materialized.
Yet, with the support level mentioned above still intact, a breakout above $68K and a new all-time high are still very likely in the short term.

The 4-Hour Chart
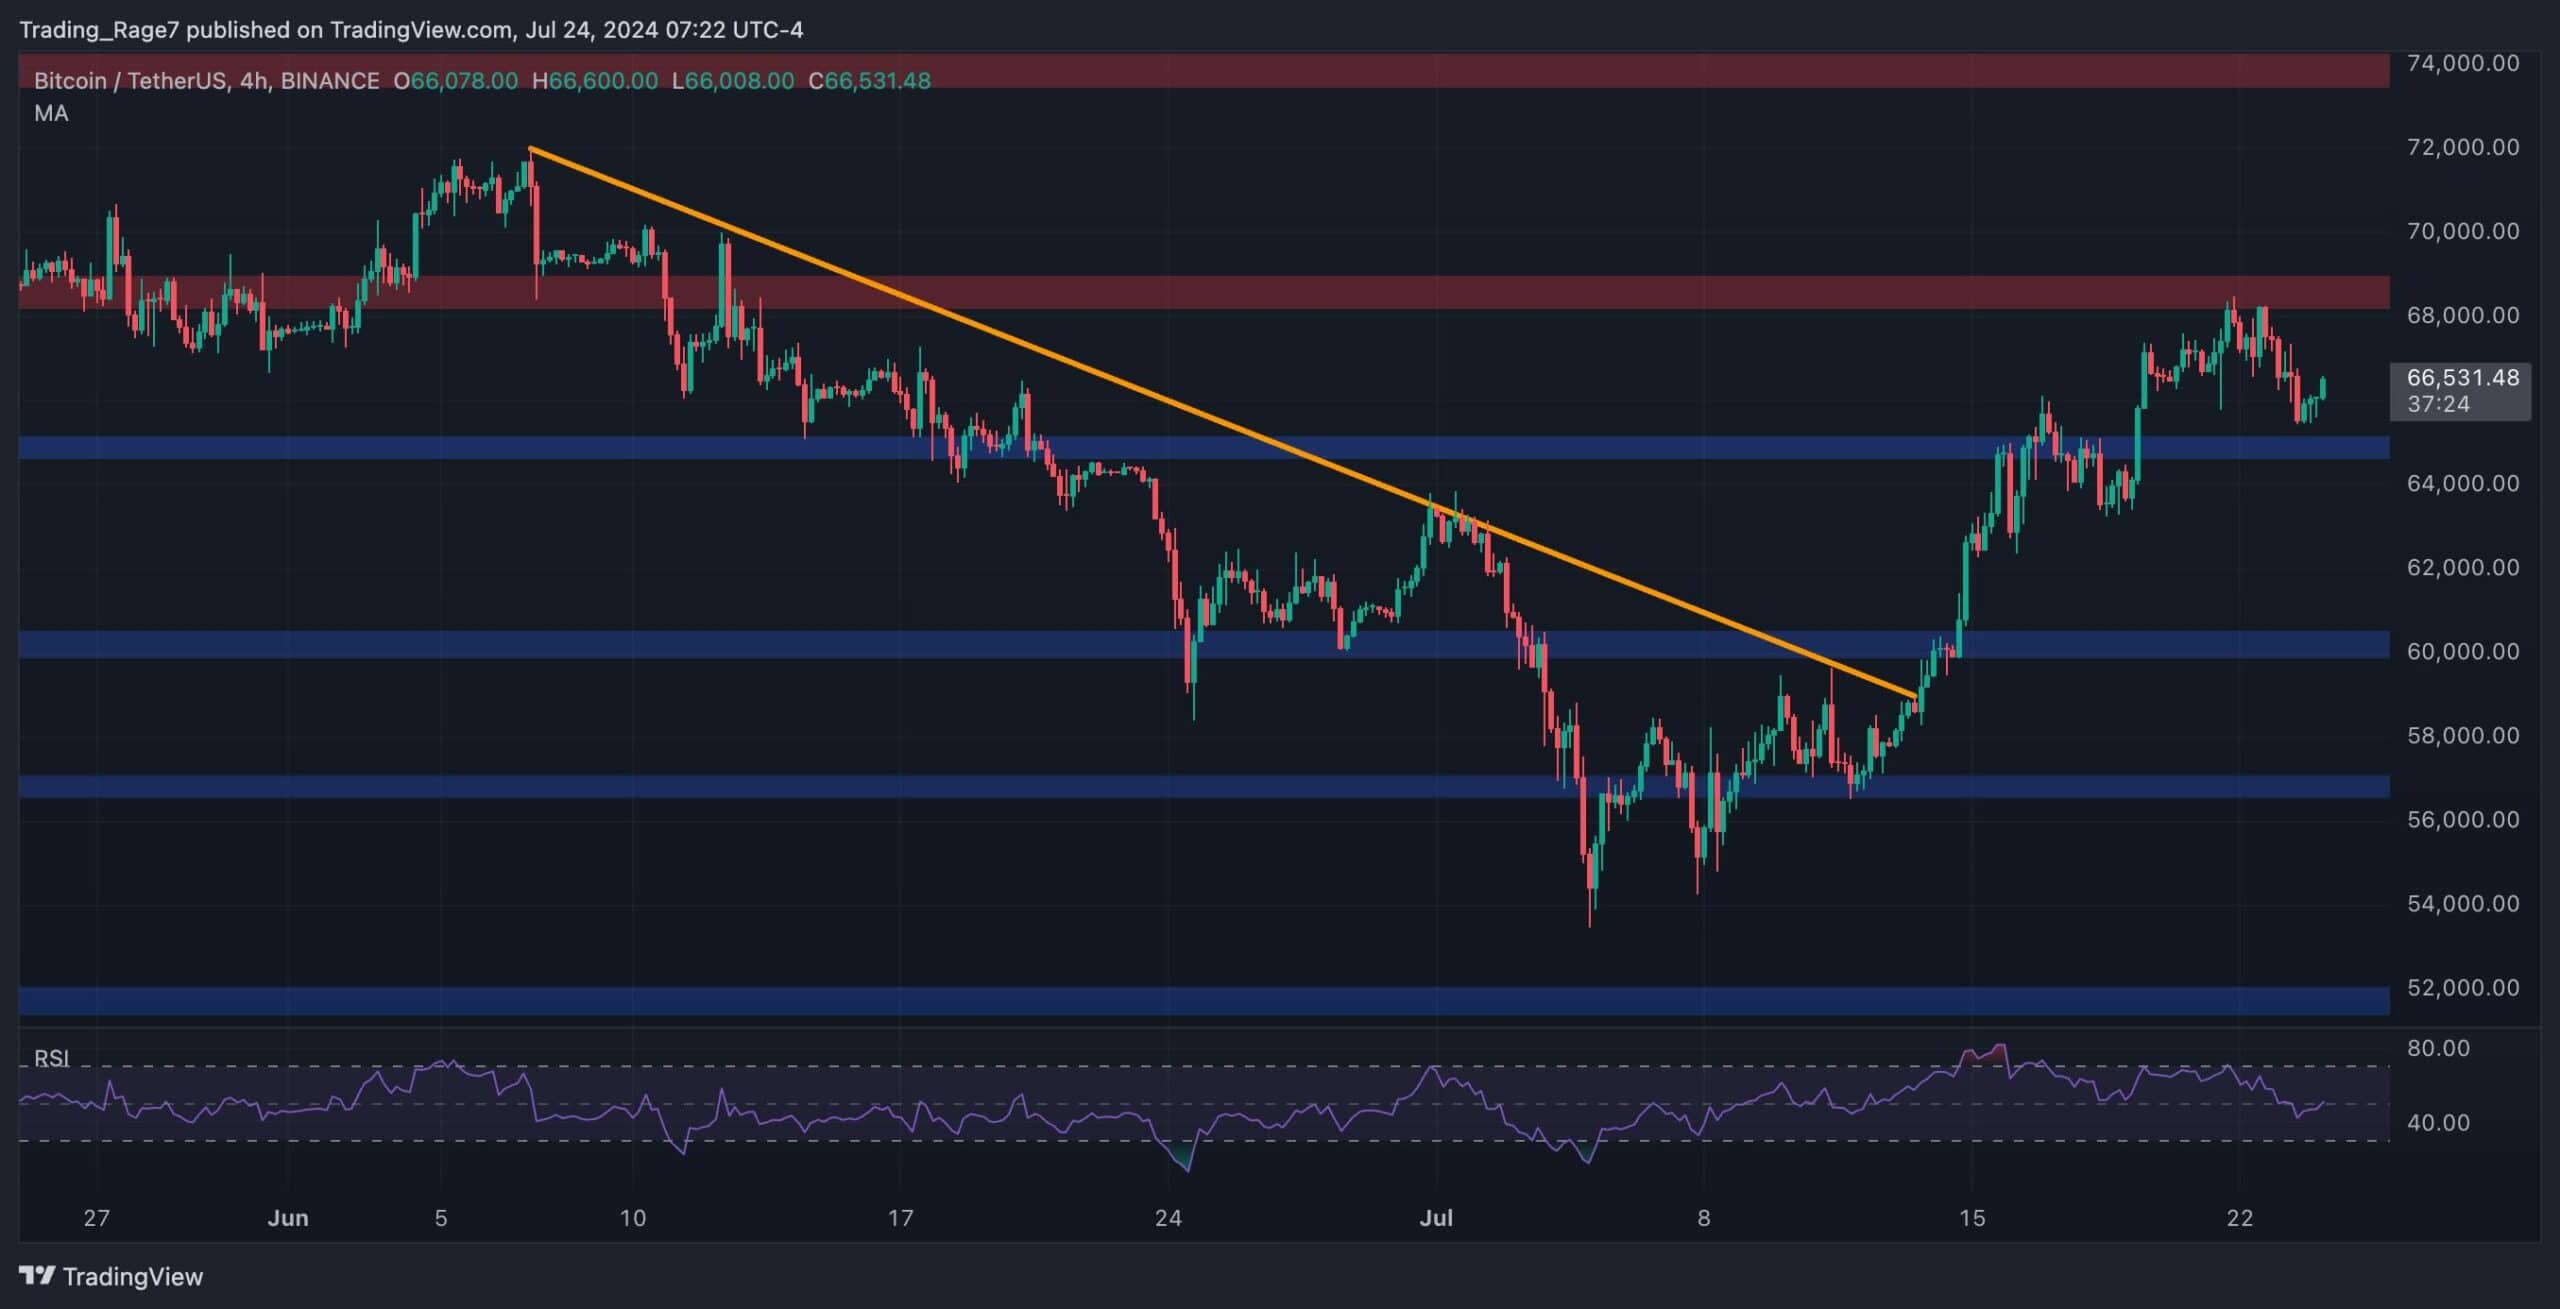
The 4-hour chart shows that while the price has been making higher highs and lows since the first week of July, the $68K resistance level has pushed the cryptocurrency lower.
The market has created some short-term lower highs and lows as the price has retreated toward the $65K support level. As long as it holds, the market is likely to push toward the $68K resistance level soon.

On-Chain Analysis
By TradingRage
Bitcoin Exchange Reserve
During the recent Bitcoin price correction from the $70K level, many market participants assumed that the bull run was over. However, the aggregate behavior of investors tells a completely different story.
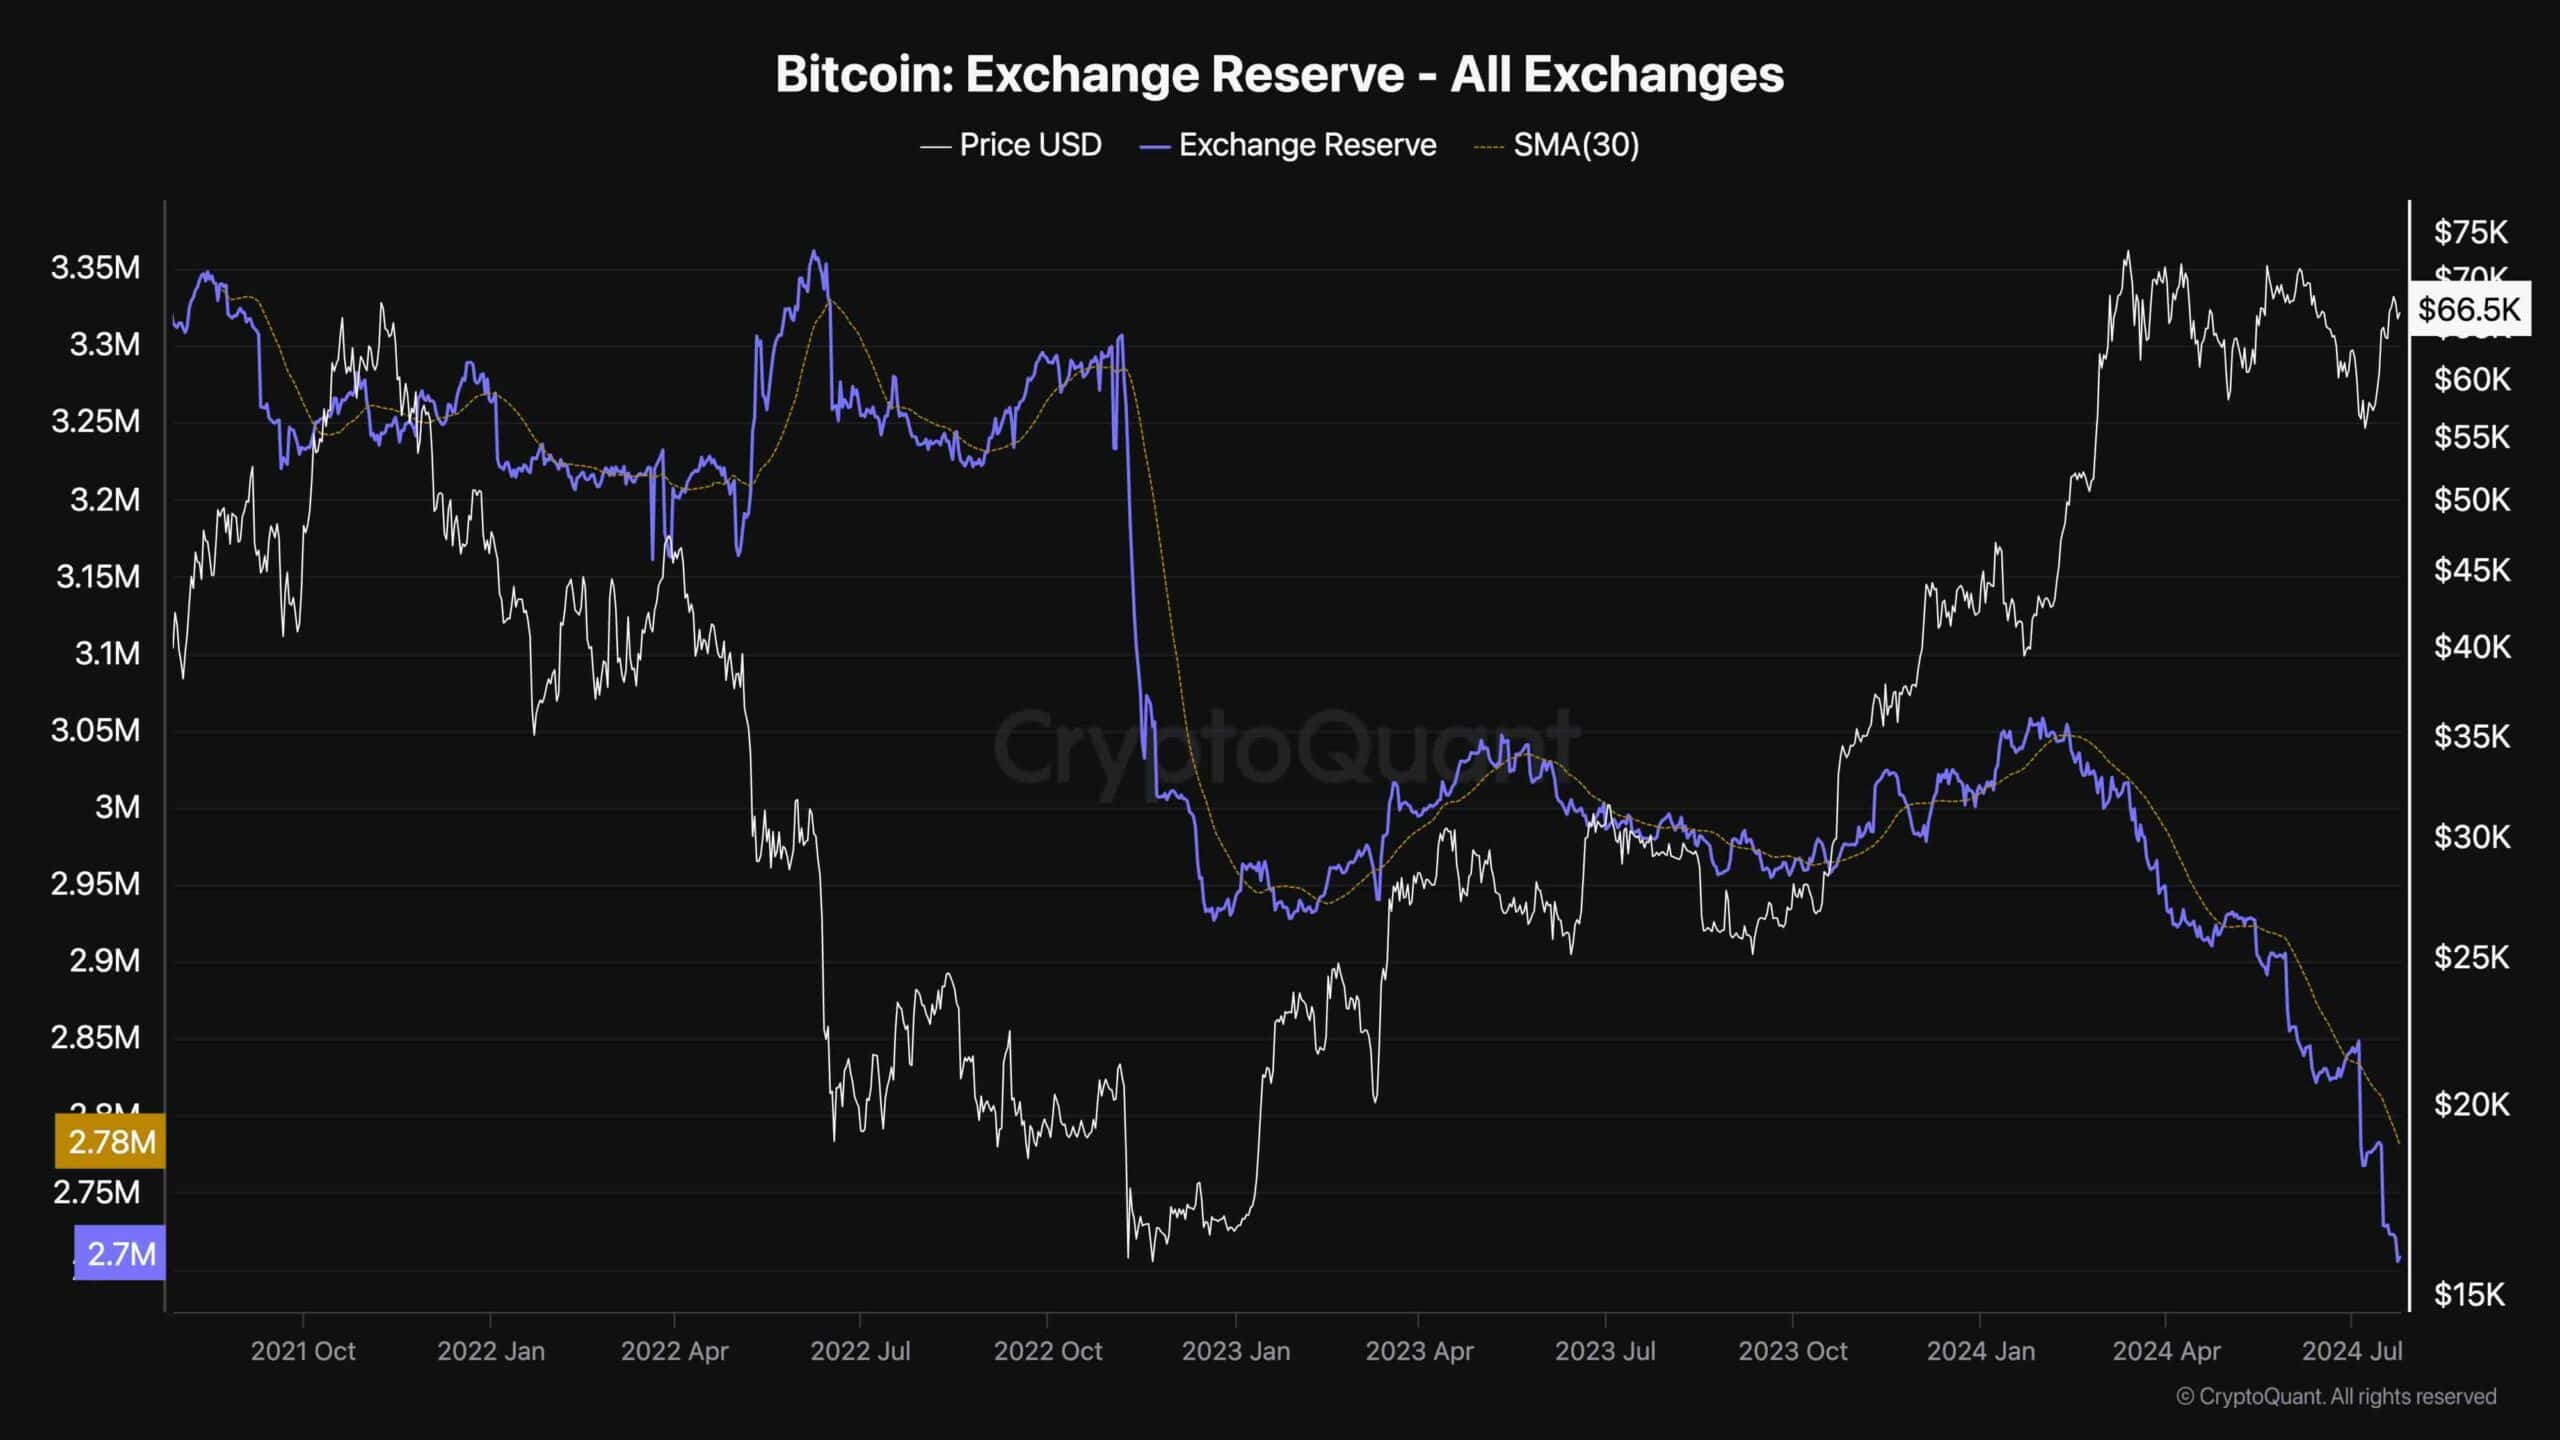
This chart presents the Bitcoin Exchange Reserve metric, which measures the amount of BTC held on exchange wallets. If there are more deposits to exchanges than withdrawals on aggregate, this metric rises, and if more BTC is withdrawn, the exchange reserve falls.
As the chart depicts, the exchange reserve metric has been dropping rapidly at a rate comparable to that of the January 2023 price bottom. Therefore, it seems that investors believe that the market will still rally higher, as they buy and withdraw coins to their personal wallets rapidly.

 cryptopotato.com