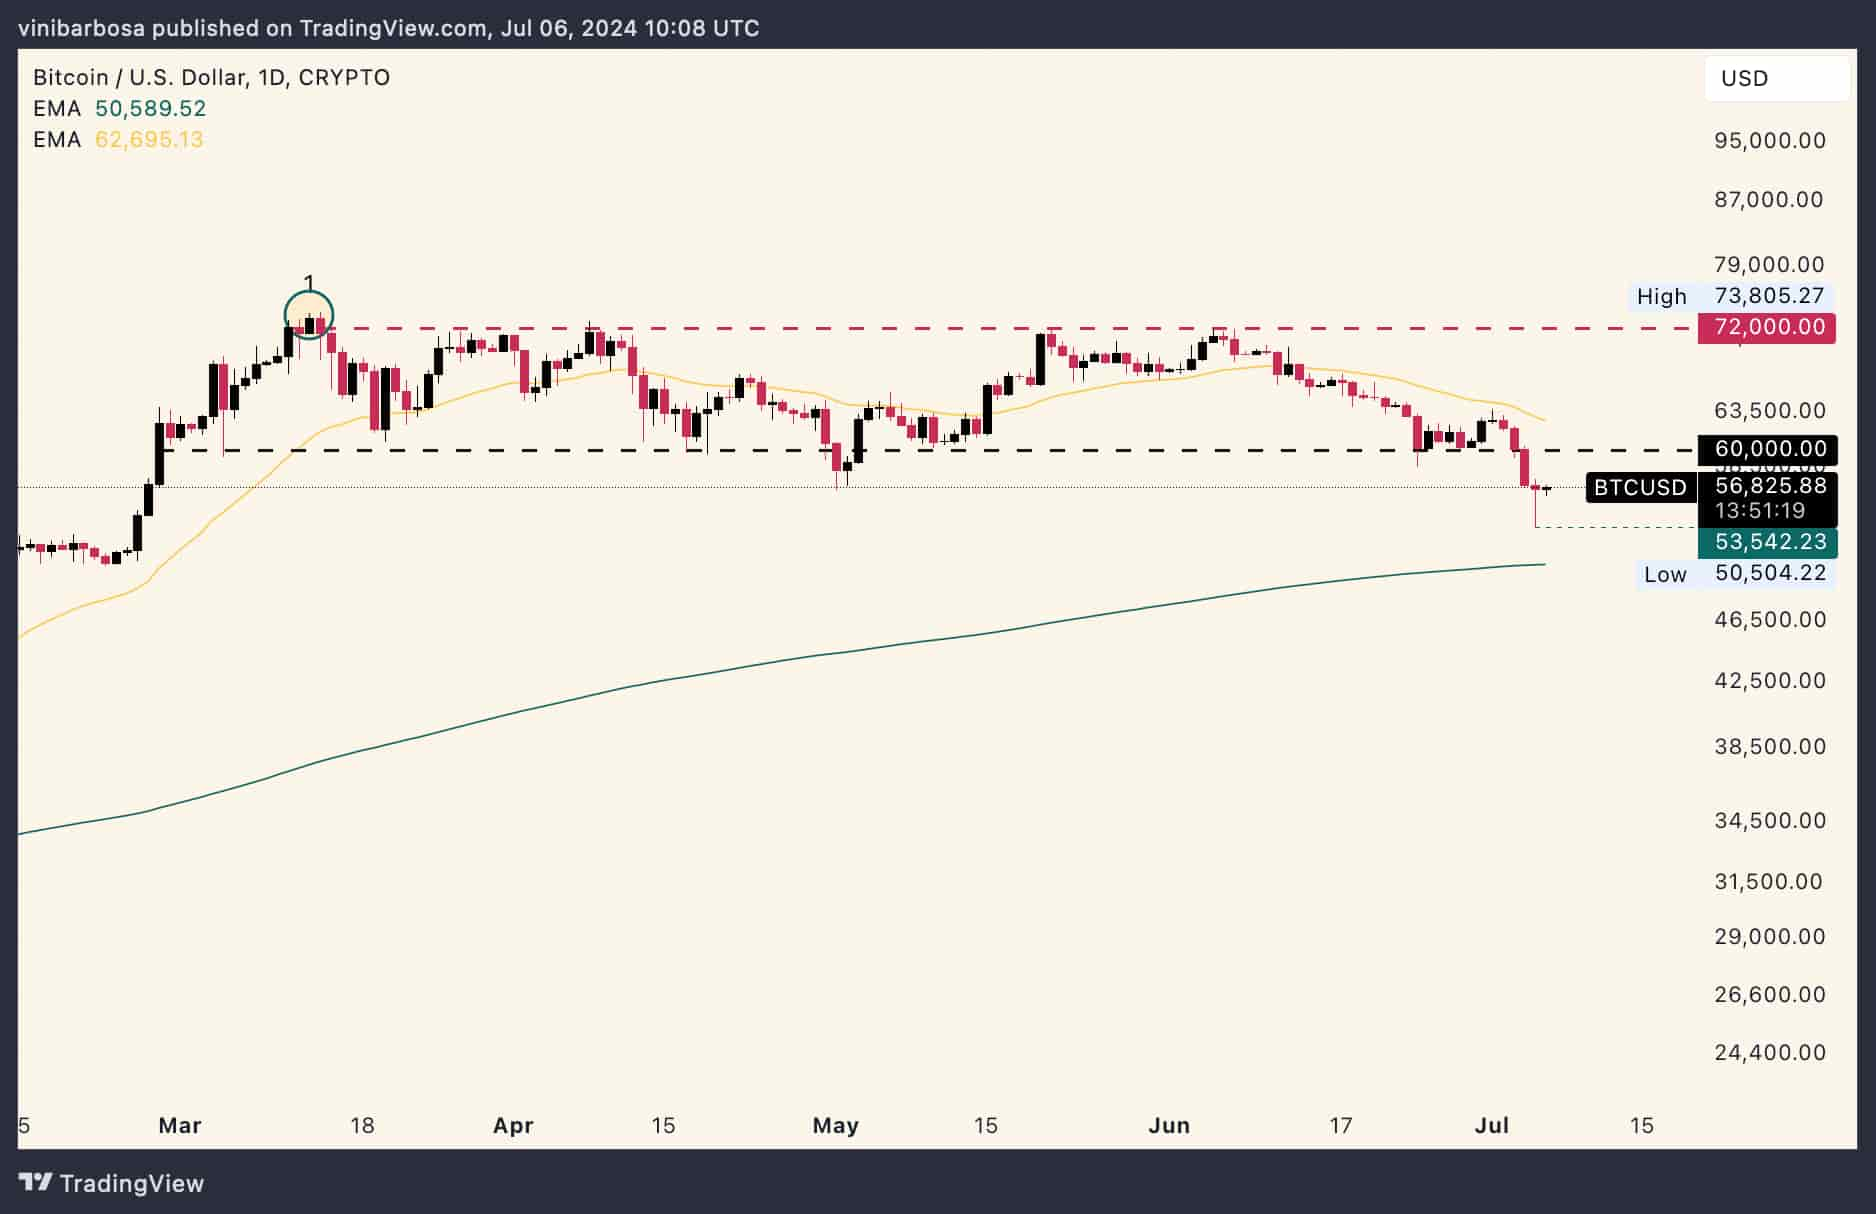
Bitcoin (BTC) has broken down from a four-month price range, shifting the sentiment from bullish to neutral and now bearish. In this context, Finbold looked to key support and resistance levels that cryptocurrency traders and investors should watch moving forward.
As of this writing, BTC trades at $56,825, halfway between $50,000 and $60,000, two key psychological levels.
Interestingly, the psychological resistance is at the broken four-month rage’s support, increasing its relevancy to regain the previous momentum. Meanwhile, the psychological support is close to the 365-day exponential moving average (365-EMA) at $50,589, an important year-over-year level. The 30-day EMA makes resistance at $62,695.

Bitcoin on-chain data for key support and resistance levels
Looking further, Finbold gathered on-chain data from IntoTheBlock on July 6, which highlights other key levels to watch for.
In particular, the “In/Out of the Money Around Price” metric suggests significant support at slightly lower prices than now. The largest volume is within the $54,810 to $56,478 level, at an average of $55,594. Notably, 747,150 addresses purchased over 569,720 BTC at these prices and are currently in profit.
However, this is the most relevant volume to the downside, suggesting that the price could go below $48,000 if BTC loses this level.
On the other hand, there is a lot of volume to the upside, suggesting strong resistance in this direction. The first level is between $59,885 and $61,553, averaging $60,875, with 1.04 million addresses and 584,250 BTC volume. The following levels show a similar status, all the way up to $65,000.

In conclusion, Bitcoin’s key support and resistance levels to watch are $50,000, $55,594, $60,000, $62,700, and $65,000. The resistance levels are more robust than the support, which suggests a breakout to the downside. It is important, however, to understand that cryptocurrencies are highly volatile digital assets, and indicators are not conclusive.
Disclaimer: The content on this site should not be considered investment advice. Investing is speculative. When investing, your capital is at risk.
 finbold.com