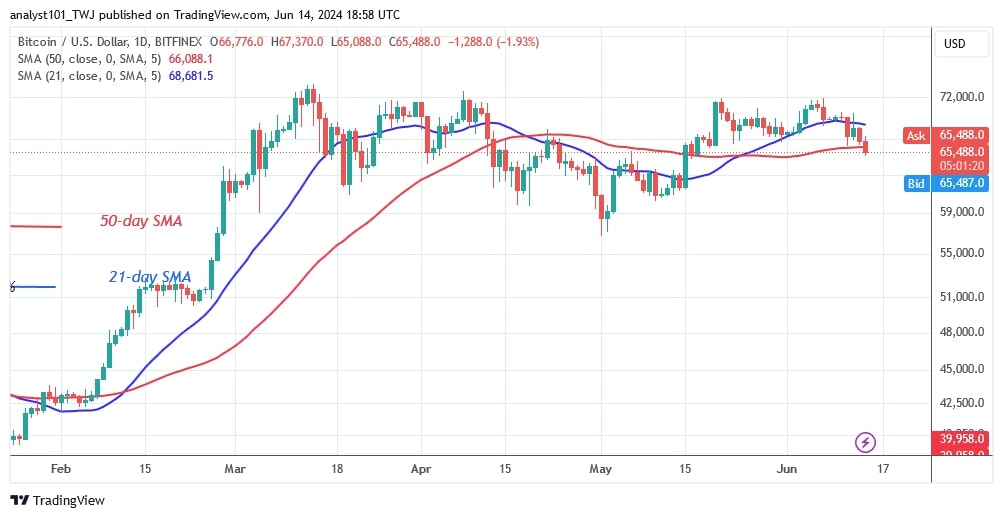
The price of Bitcoin (BTC) has fallen below the moving average lines, but the bulls are trying to stop the decline above the 50-day SMA.
Long-term forecast for the Bitcoin price: bearish
According to price analysis by Coinidol.com, the price of the cryptocurrency will fluctuate between the moving average lines if it holds above the 50-day SMA.
Nevertheless, the largest cryptocurrency risks a further decline if Bitcoin slips below the moving average lines. BTC/USD is worth $65,716 at the time of writing. On the downside, Bitcoin will fall to $60,000 if it loses the 50-day SMA support. In the meantime, the altcoin is pausing above the $65,000 support.
Bitcoin indicator reading
The price of the cryptocurrency fell below the moving average lines but recovered above the 50-day SMA. In other words, Bitcoin is between the moving average lines. Bitcoin is trading above the 50-day SMA but below the 21-day SMA. The decline has paused above the 50-day SMA.
Technical indicators:
Key resistance levels – $70,000 and $80,000
Key support levels – $50,000 and $40,000

What is the next direction for BTC/USD?
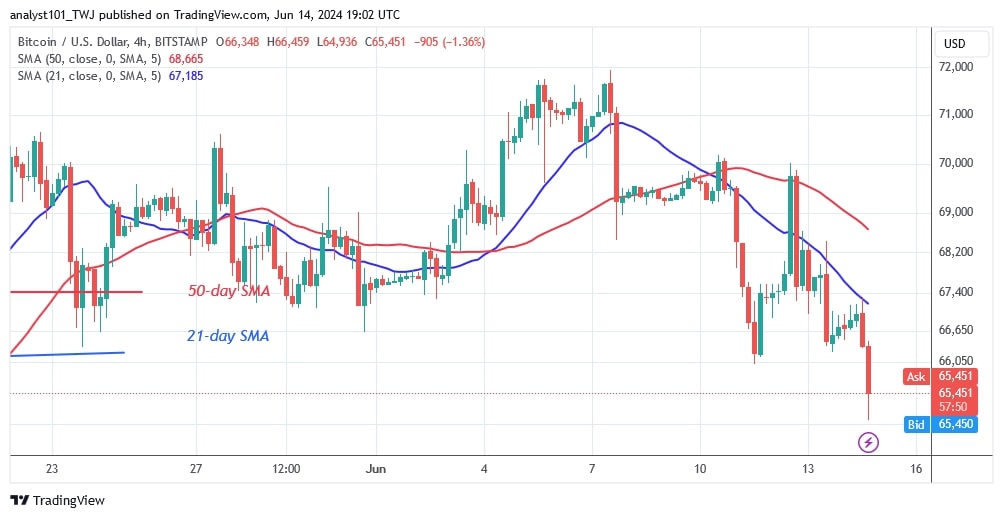
Bitcoin has slipped below the moving average lines but remained above the 50-day SMA. In other words, the BTC price fell to a low of $65,088 before recovering above the $66,000 support. On the upside, the cryptocurrency will test its previous high of $70,000 if the current support holds. The 4-hour chart of Bitcoin shows an upward correction, but there is a first obstacle at the high of $66,567.

Disclaimer. This analysis and forecast are the personal opinions of the author and are not a recommendation to buy or sell cryptocurrency and should not be viewed as an endorsement by CoinIdol.com. Readers should do their research before investing in funds.
 coinidol.com
