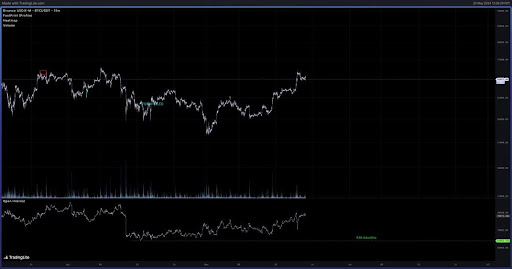
According to the crypto analyst, Open Interest has reached 78,000 $BTC, significantly higher than its baseline of 64,000 $BTC. CrediBull Crypto revealed that this current Open Interest was in a danger zone. This is because the 14,000 $BTC difference typically indicates elevated market activities, which often precede volatile price movements.
Additionally, the CrediBull Crypto revealed that a single unidentified Bitcoin whale was responsible for approximately 10,000 $BTC of the increased 14,000 $BTC Open Interest. This means that the anonymous whale controls 70% of all the added Open Interest on Binance perpetual futures since the baseline.
He also disclosed that in the scenario where the anonymous whale can withstand 10% to 15% downward pressure without liquidating their assets, the actual available Open Interest that would be vulnerable to a decline would be only 4,000 $BTC, instead of the initial 14,000 $BTC addition. The analyst revealed that out of the 4,000 $BTC, some would be directional shorts, noting that the net long positions at risk would be even lower.
Given this theory, CrediBull Crypto argued that the potential for a downside is more limited. As a result, the ultra bull scenario where Bitcoin’s price surges to new all-time highs was worth considering.
Potential Retracement Towards $60,000
In his YouTube video, CrediBull Crypto also highlighted a potential retracement slightly above the $60,000 price mark. The analyst predicted a bearish scenario, where Bitcoin could see its price falling significantly towards $62,000 to $63,000.
At the time of writing, Bitcoin’s price is trading at $69,774, reflecting a 0.08% decrease in the last 24 hours, according to CoinMarketCap. CrediBull Crypto disclosed that Bitcoin had failed to break through key resistance levels above $70,000.
He predicts that consistent declines and liquidations could potentially trigger a bottom below $60,000. However, he also revealed that such a bearish turnaround was highly unlikely at this time, as Bitcoin’s price movements currently indicates an ultra bullish scenario.
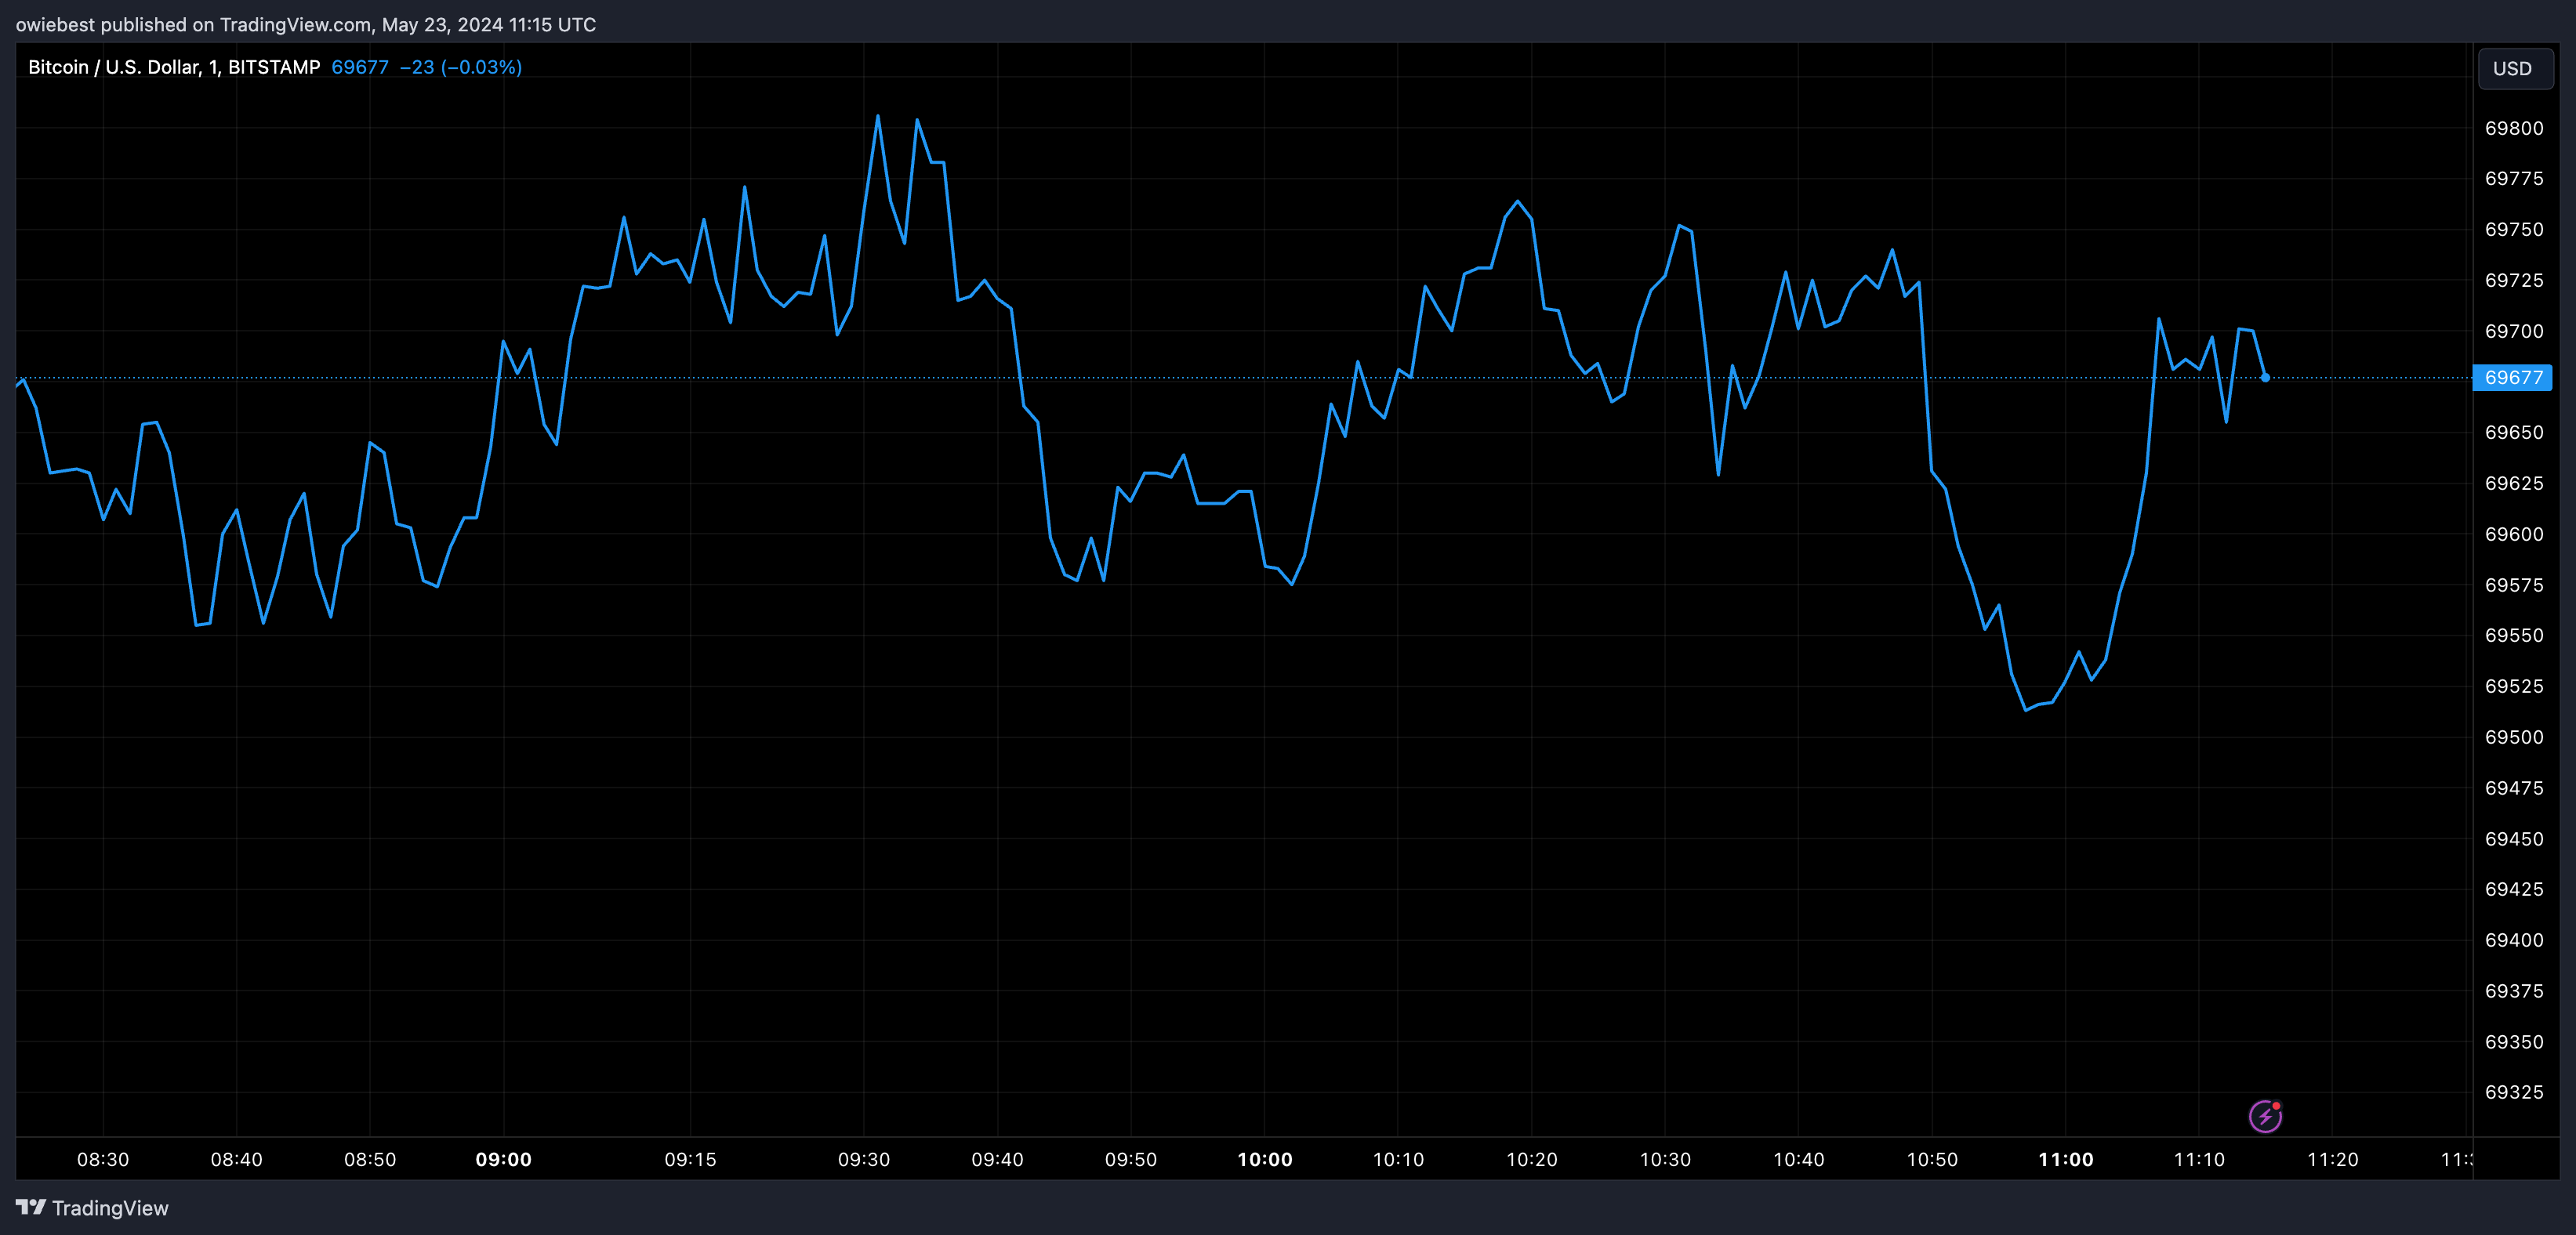
Featured image created with Dall.E, chart from Tradingview.com

 newsbtc.com