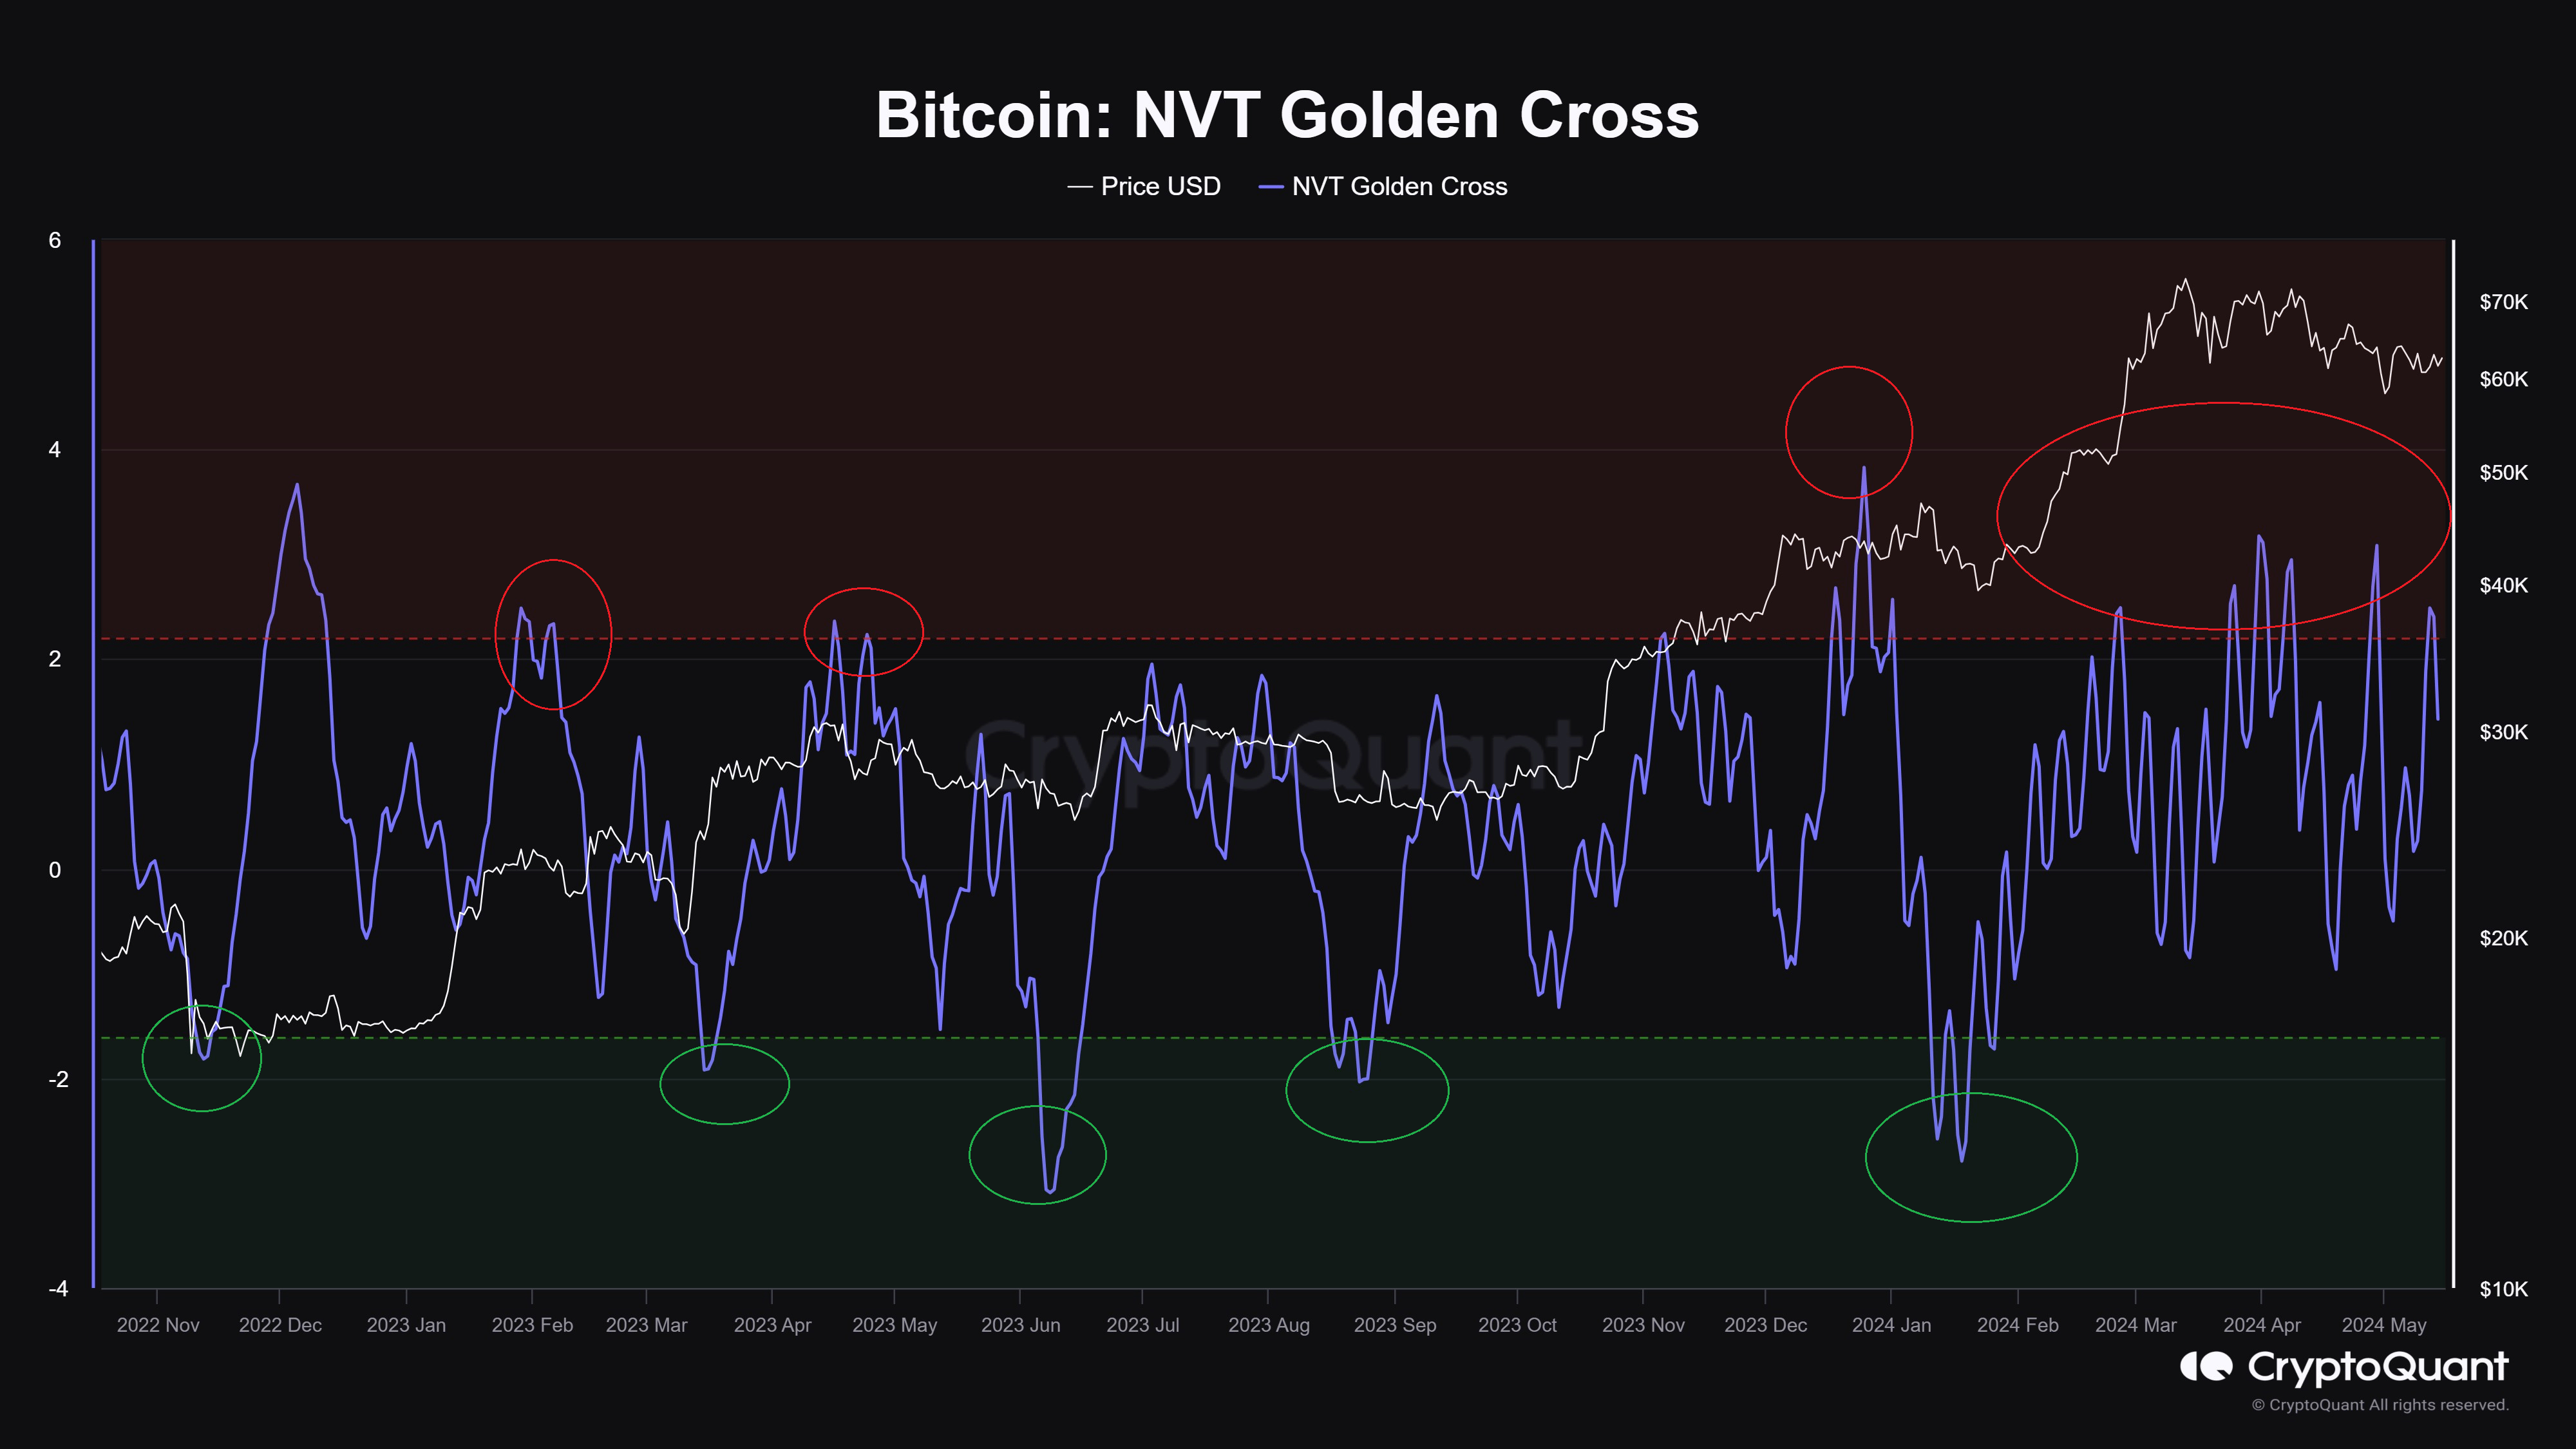
In the graph, the quant has highlighted the two relevant zones for the Bitcoin NVT Golden Cross. It would appear that when this metric is above 2.2, a top can be probable for the cryptocurrency as its price is overvalued in this zone. Similarly, the NVT Golden Cross being under -1.6 can lead to a bottom formation for the asset.
The Bitcoin NVT Golden Cross has ventured into the red territory for the last couple of months. Each time it has seen a decline out of the zone, it has followed up with another rise into the zone. As such, it hasn’t been able to visit the bullish region yet.
At present, the metric has just made another exit out of the top zone, but its value is still quite near it. Thus, while a top may not be especially probable now, a lasting uptrend is also unlikely to happen.
 newsbtc.com
