Bitcoin (BTC) has recently demonstrated a significant recovery, climbing above the $60,000 threshold, a development that follows a tumultuous week where its price dropped below $57,000 prior to the Federal Open Market Committee (FOMC) meeting.
This marked a surprising 8% drawdown, sending Bitcoin to its lowest in two months. However, amid a broader stock market rise and a weaker-than-expected US jobs report, Bitcoin’s price trajectory is looking optimistic.
In this context, RLinda, a prominent crypto analyst and professional trader, emphasized the importance of the key $64,500 level for Bitcoin in her May 5 TradingView post.
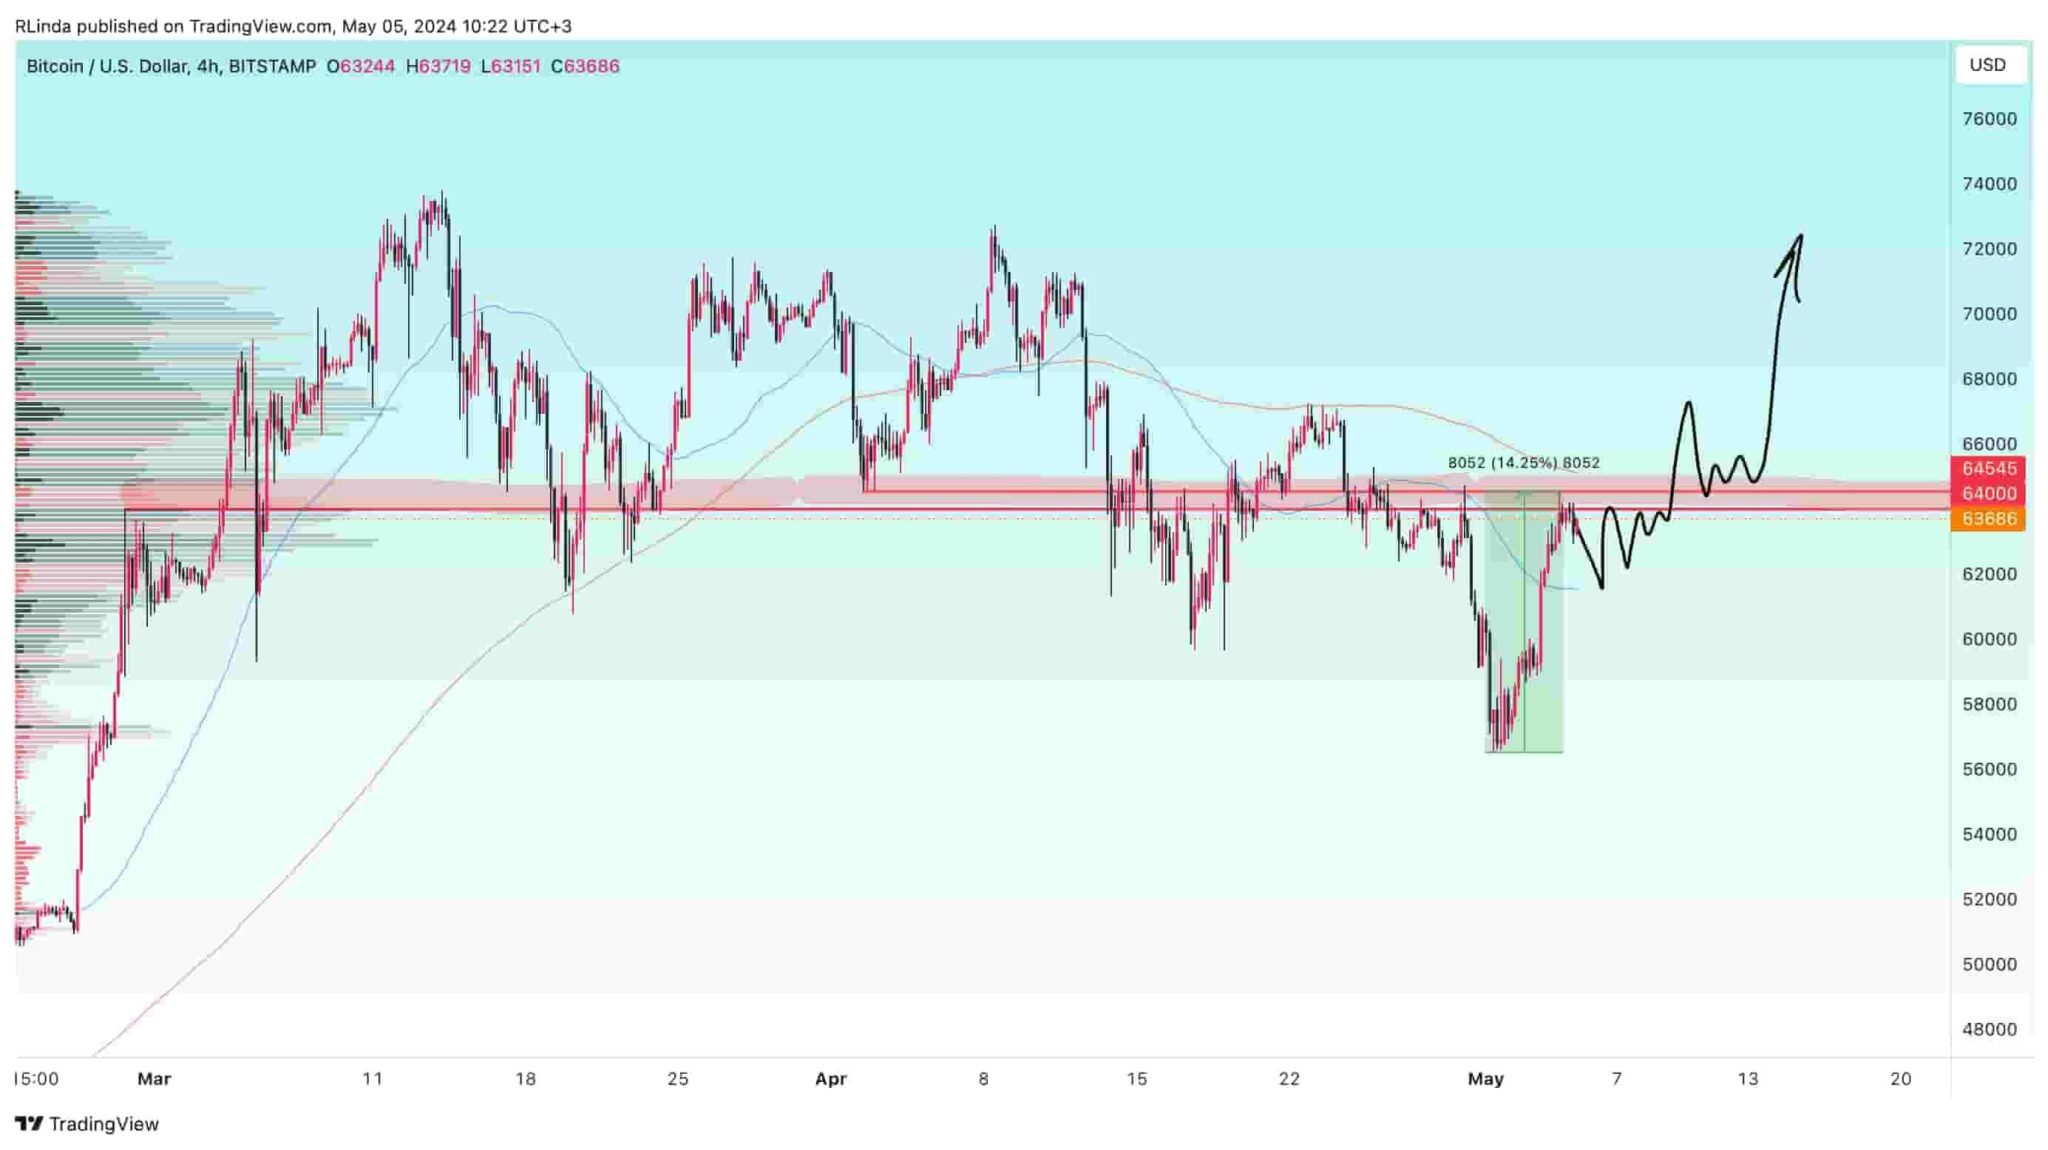
A breakout and consolidation above this key resistance could set the stage for further growth, potentially propelling prices towards $73,000. Such a movement would signify a shift in market dynamics from neutral to decidedly bullish.
“The trend is still strong and bullish. The price is in a sideways range and continues to collect liquidity. The range boundaries are 73500 – 60000K. The key level below which there is a huge pool of liquidity is 59300-59500, there is a high probability that Bitcoin can test this area before further growth. I am expecting a rise because Bitcoin’s technical and fundamental components look very promising: Bullish trend, liquidity gathering at the expense of sellers (potential for growth), buyers are very confident to keep the price in the range, introduction of BTC-ETF in Hong Kong, which will only attract new investors and their money.”- she said
RLinda‘s analysis points out that while the $64,500 level is a crucial hurdle for Bitcoin, it’s equally important to consider the support levels that underpin the current price structure.
Key liquidity pools are observed between $59,300 and $59,500. Breaching these levels could lead to a significant price surge. However, support levels at $61,500, $60,200, and particularly $59,300 must hold to prevent further declines. If these support zones are crushed, Bitcoin could face a sharp downturn, challenging the bearish thresholds.
Market trends and strategic outlook
With increasing institutional interest, as demonstrated by substantial investments in Bitcoin exchange-traded funds (ETF) the bullish sentiment around Bitcoin continues to solidify.
RLinda advises traders to closely monitor the market’s reaction to significant price levels and adjust their strategies accordingly, whether they are targeting bounce plays or preparing for potential false breakouts.
A crucial risk zone to watch is around $58,900. A breach here could indicate mounting downward pressure, confirming a bearish trend for Bitcoin.
Conversely, maintaining momentum above the $64,500 resistance level could confirm the market’s bullish outlook, setting Bitcoin on a path toward higher valuations.
Bitcoin price analysis
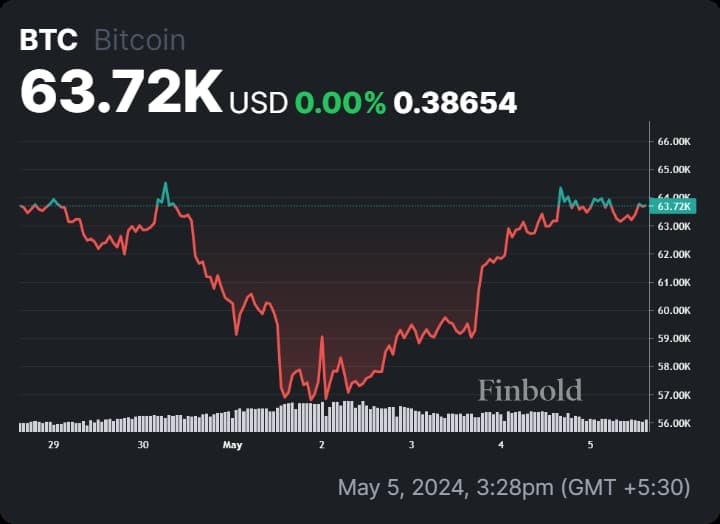
By press time, Bitcoin was trading at $63,720 with daily corrections of almost 0.86%. On the weekly chart, Bitcoin is down over 0.07%

Elsewhere, a review of Bitcoin’s technical analysis shows a bullish momentum. A summary of the one-day gauges recommends ‘buy’ at 11; whole moving averages are for a ‘buy’ at 10. Despite Oscillators remaining ‘neutral’ at 8, there is a strong sentiment among traders anticipating an upward movement in price.
Overall, the market remains poised on the edge of a potential movement, likely setting the stage for an upcoming rally.
Disclaimer: The content on this site should not be considered investment advice. Investing is speculative. When investing, your capital is at risk.