TL;DR Breakdown
- Bitcoin price analysis shows a downtrend today in the bearish market.
- The BTC token has lost 3.33% to trade at $26,238, a low for today so far.
- Support for BTC/USD is present at the $26,106 level.
The latest Bitcoin price analysis shows a strong bearish trend. The bears are reigning the price charts as the price has decreased again during the day. Currently, it is settled on the $26,238 mark, almost 3.33% in the red. The price continued to fall as bears sent BTC/USD below the psychological level of $27,000, reaching a low of $26,106 during the day.
Since bulls haven’t shown any indications of recovering momentum, bears will likely keep BTC under their thumb for the foreseeable future. Due to this anticipation, investors fled the market, bringing the market capitalization of Bitcoin to $510 billion, with a decrease of 3.33 percent in the last 24 hours. However, the trading volume traded in the last 24 hours stands at $15 billion, signaling that some traders are still optimistic. This decline indicates that bears still have the upper hand in the market and that bulls’ chances of making a comeback are low in the eyes of traders.
Bitcoin price analysis 24-hour price chart: BTC shows a strong bearish trend on the chart
Looking at the 1-day price chart for Bitcoin price analysis shows the price has decreased quite steadily because of the constant increase in bearish momentum. Bears have been successful in taking control of the market, pushing BTC/USD to a low of $26,106. However, bulls are still trying to make a comeback as sellers seem to be struggling for momentum.
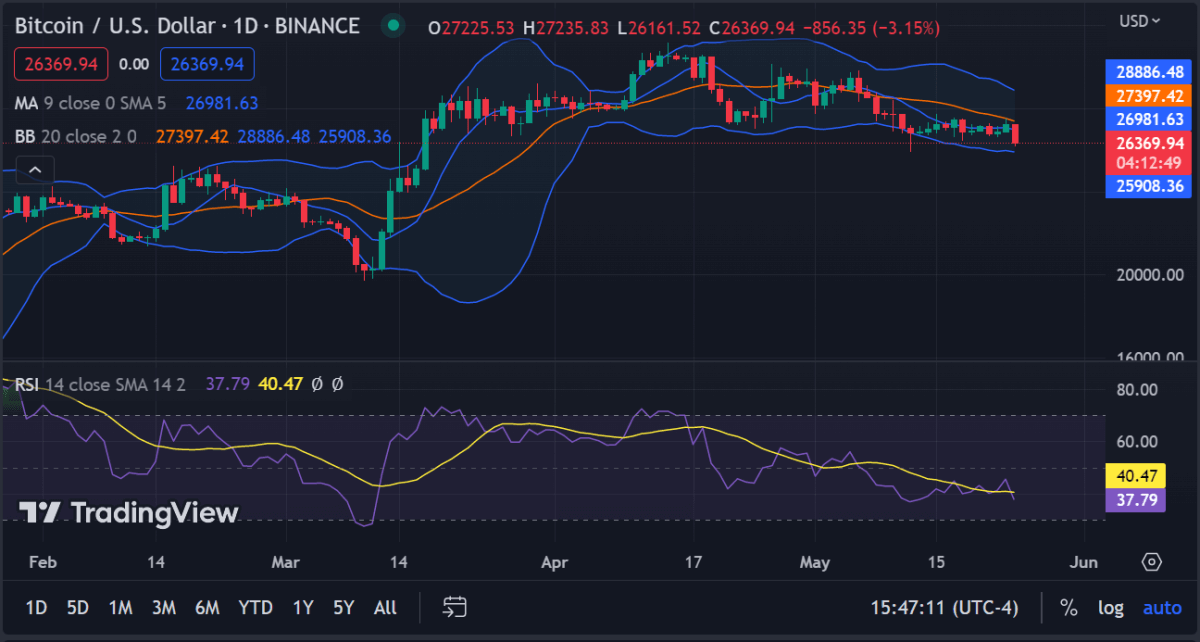
BTC’s Relative Strength Index (RSI) value of 37.79 and recent plunge below its signal line indicate that BTC is now in a bearish market, making it a potentially profitable buy for investors wanting to capitalize on current market conditions. The Bollinger bands are also narrowing, suggesting that volatility is decreasing and consolidating within a certain range. The upper Bollinger band is located at the $28,886 mark, and the lower band is at $25,908. The moving average indicator (MA) is also showing a bearish sentiment as the 50-day MA line crosses below the 100-day MA line.
Bitcoin price analysis 4-hour price chart: Downtrend shows no sign of reversal
The 24-hour Bitcoin price analysis chart shows the coin is trading in a strong downtrend, and bears are dominating the market. The pair has formed a series of lower highs and lower lows, indicating that selling pressure is intensifying.
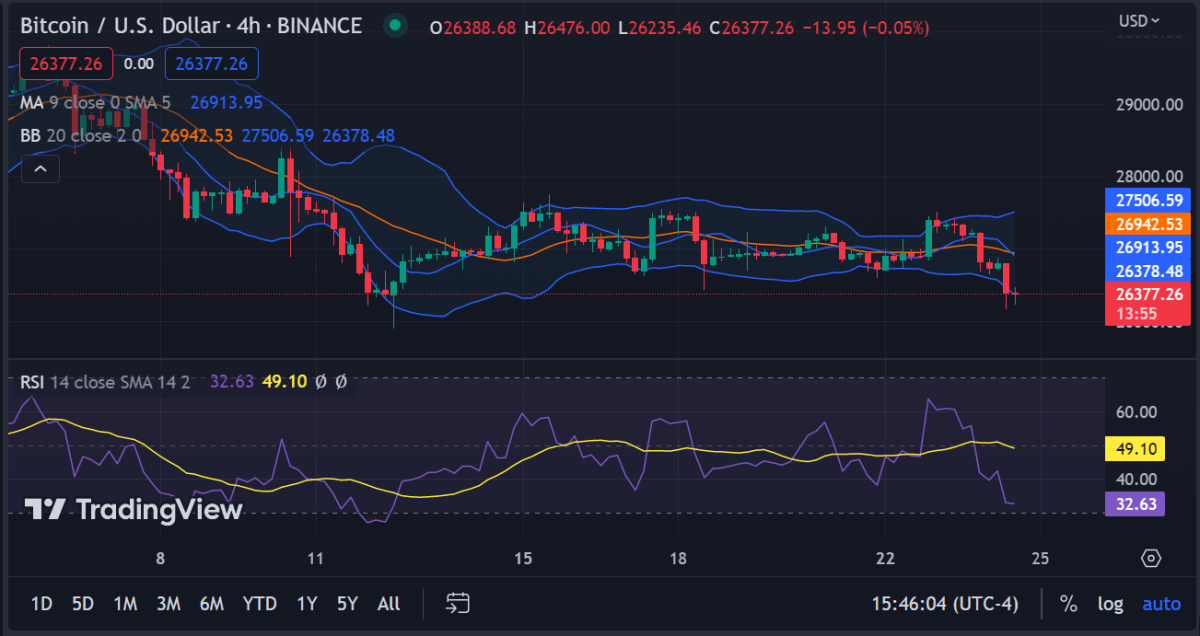
The moving average (MA) value is still standing high as compared to the current price of $26,913. The SMA 20 curve is going higher as well because of the previous bullish trend. The Relative Strength Index (RSI) also confirms the bearish market sentiment as it stands at 32.63, way below the oversold level and signaling that there is more bearish pressure to come. Following the breakthrough of the Bollinger Bands are now squeezing together, which is a sign of reduced volatility. The lower band is located at $26,378, and the upper one is at $27,506.
Bitcoin price analysis conclusion
All in all, Bitcoin price analysis shows that the market sentiment continues to be bearish despite some bullish attempts made by bulls. The selling pressure is still strong and if any further declines occur, then the $26,000 level could be tested. The indicators also indicate that the bears are in control, and any sign of recovery is a long way off.
While waiting for Bitcoin to move further, see our Price Predictions on XDC, Polkadot, and Curve