The price of Bitcoin (BTC) was little changed on May 18 compared to yesterday's daily close as traders awaited more clarity on the looming debt crisis in the United States.
Slight gains for Bitcoin as market sentiment rises
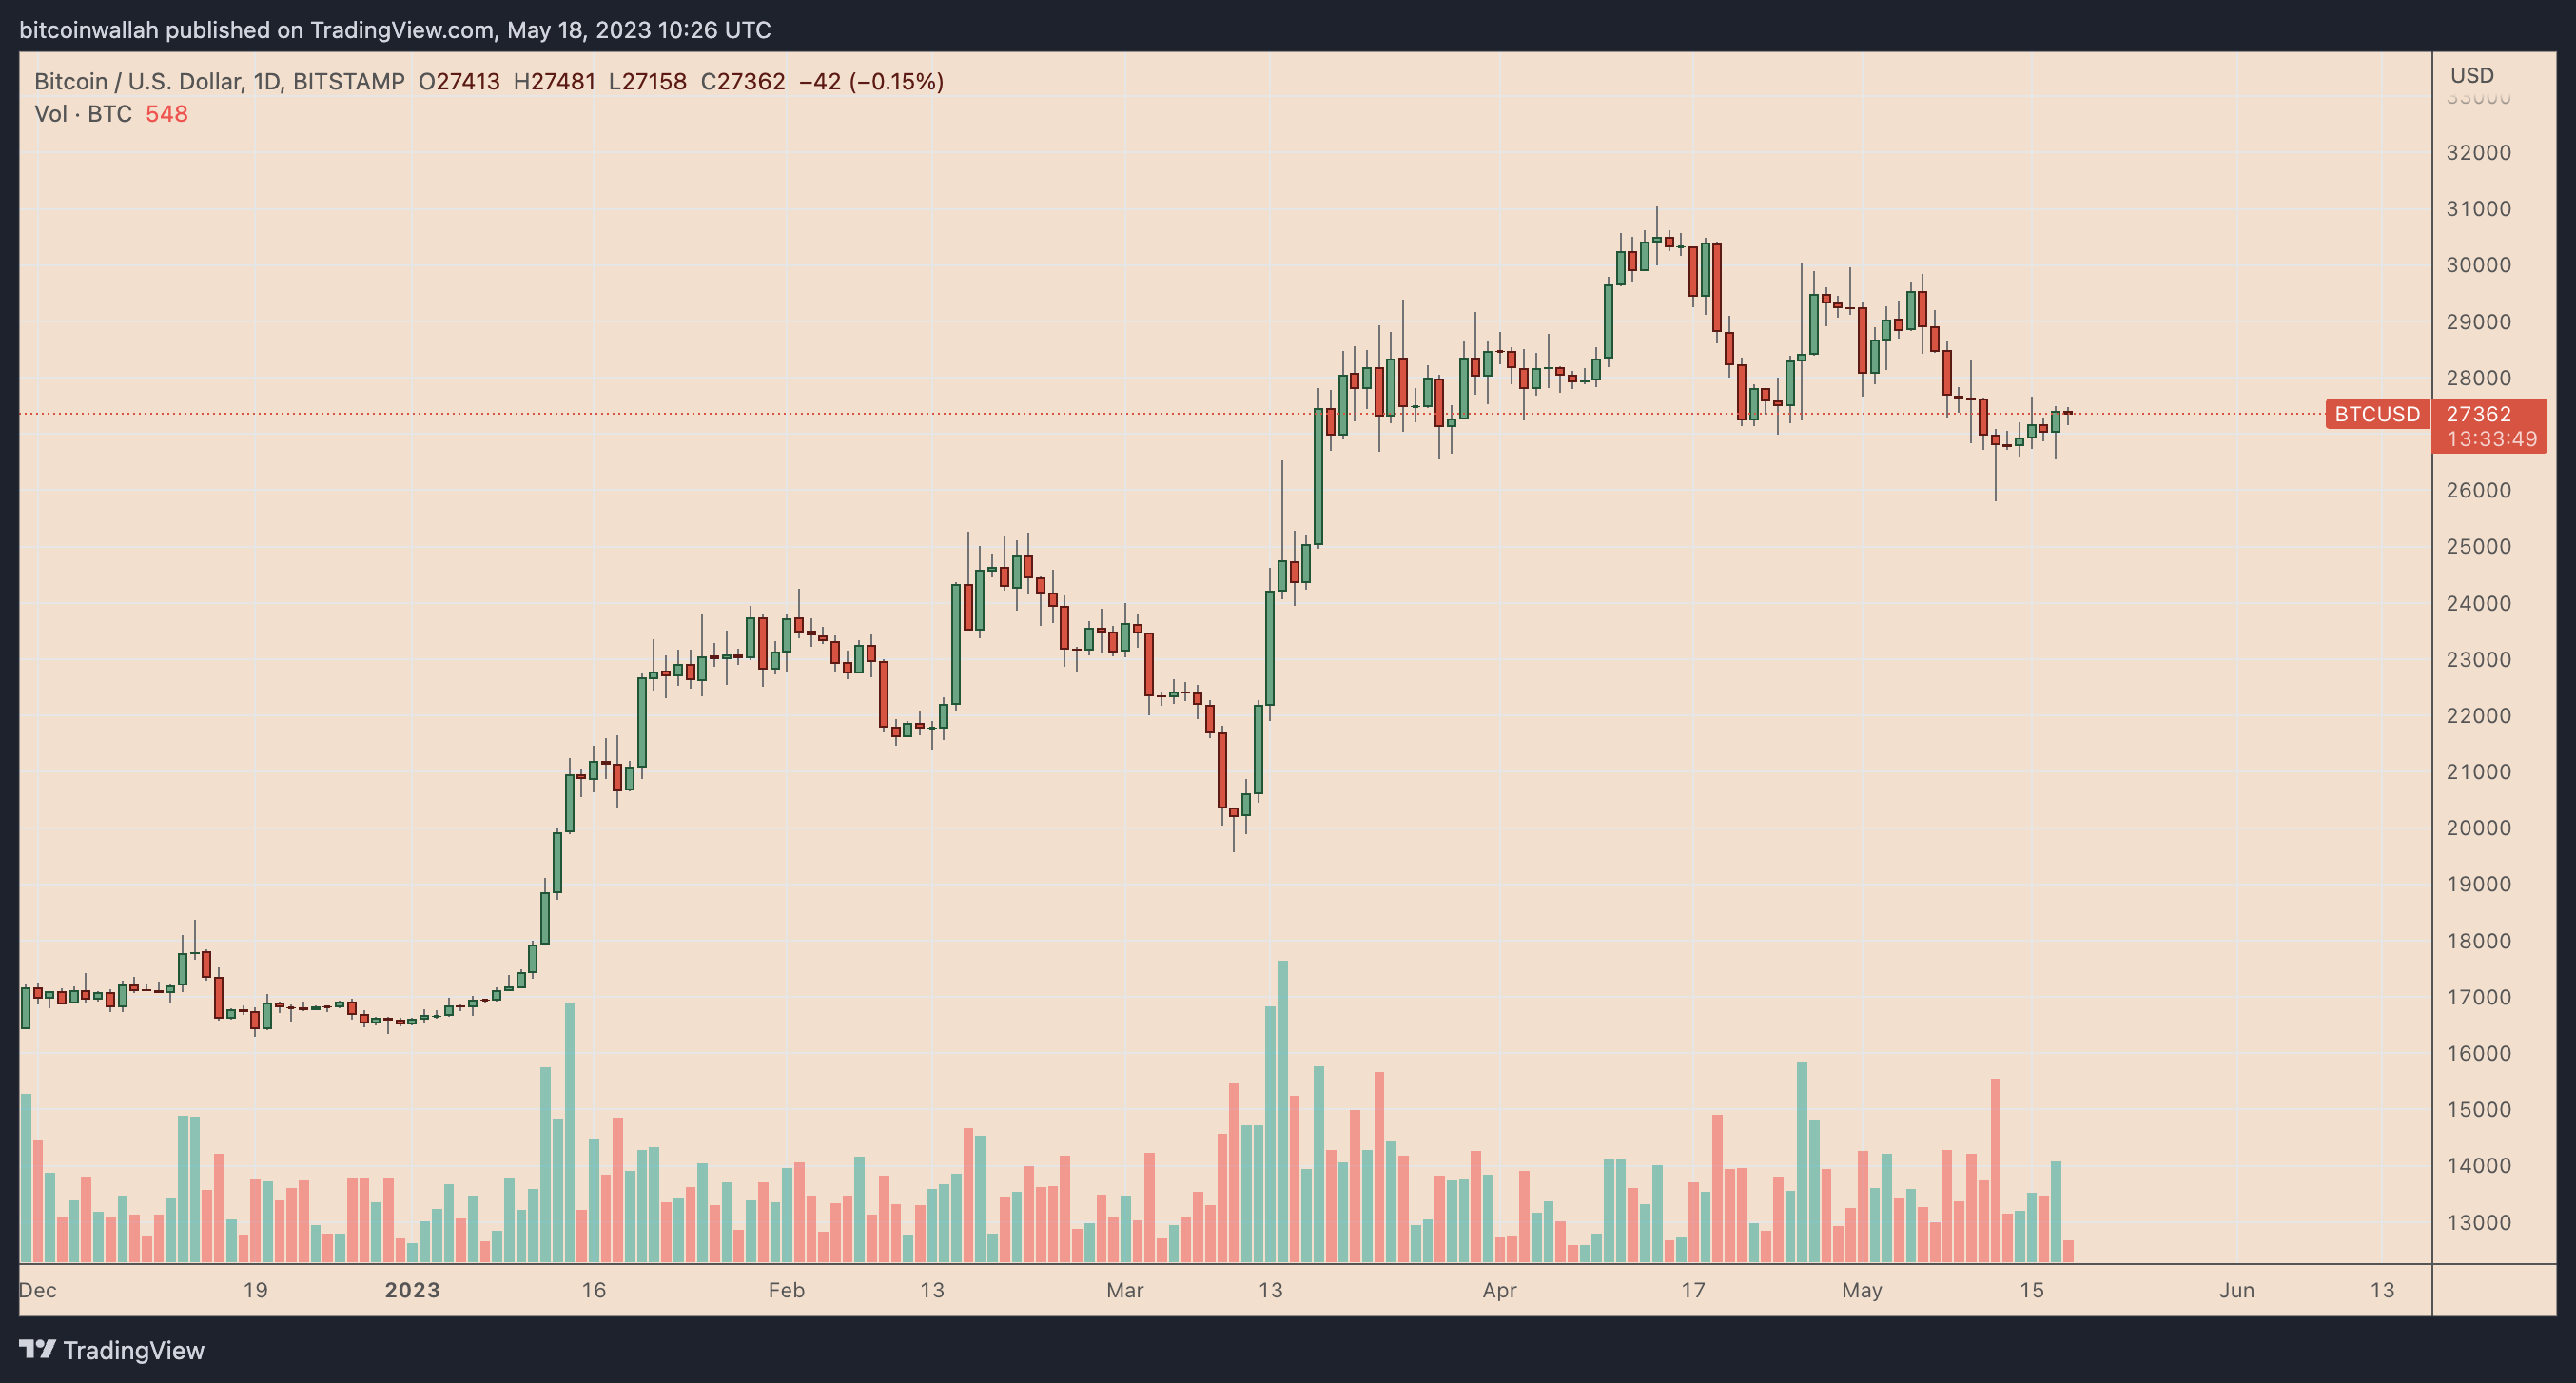
On May 17, U.S. President Joe Biden expressed his confidence in ending the standoff with Republicans to avoid a default, which boosted market sentiment. Bitcoin rose 1.5% thereafter, reaching over $27,400 on the day.
Bitcoin's recovery may have also gained momentum on Tether announcing it will deploy 15% of its monthly operational profits to buy Bitcoin.
How much is Bitcoin worth in other currencies? See our Bitcoin & Cryptocurrency Calculator
Overall, the price of Bitcoin is up 65% on year-to-date, but still down 60% from its record high of $69,000 in November 2021.
Bitcoin price must overcome stronger dollar
Bitcoin risks dropping in May thanks to a flurry of strong U.S. economic data earlier this week, which puts June's interest rate hike back on the map.
For instance, after two flat months, the country's industrial output jumped 0.5% in April, beating expectations of 0.1% growth.
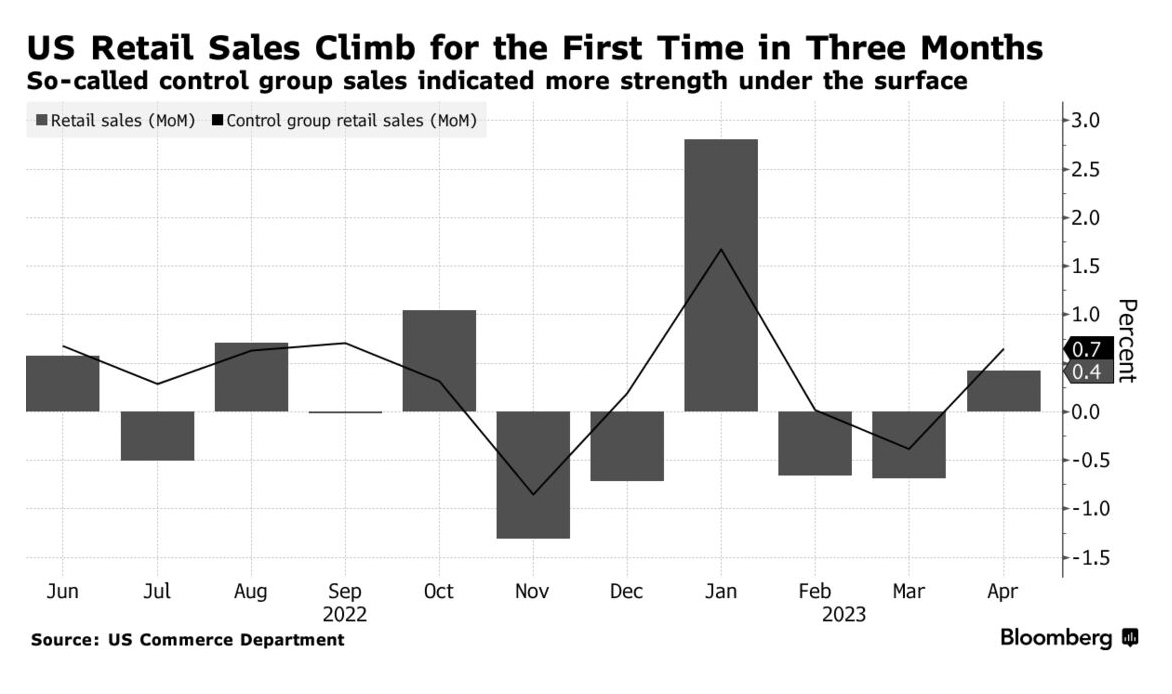
Meanwhile, retail sales increased by 0.4% in April after a 0.7% decrease in the previous month. This suggests that consumer spending held up despite facing economic headwinds.
The prospects of another rate hike lifted U.S. Treasury yields, which, in turn, boosted appetite for the U.S. dollar.
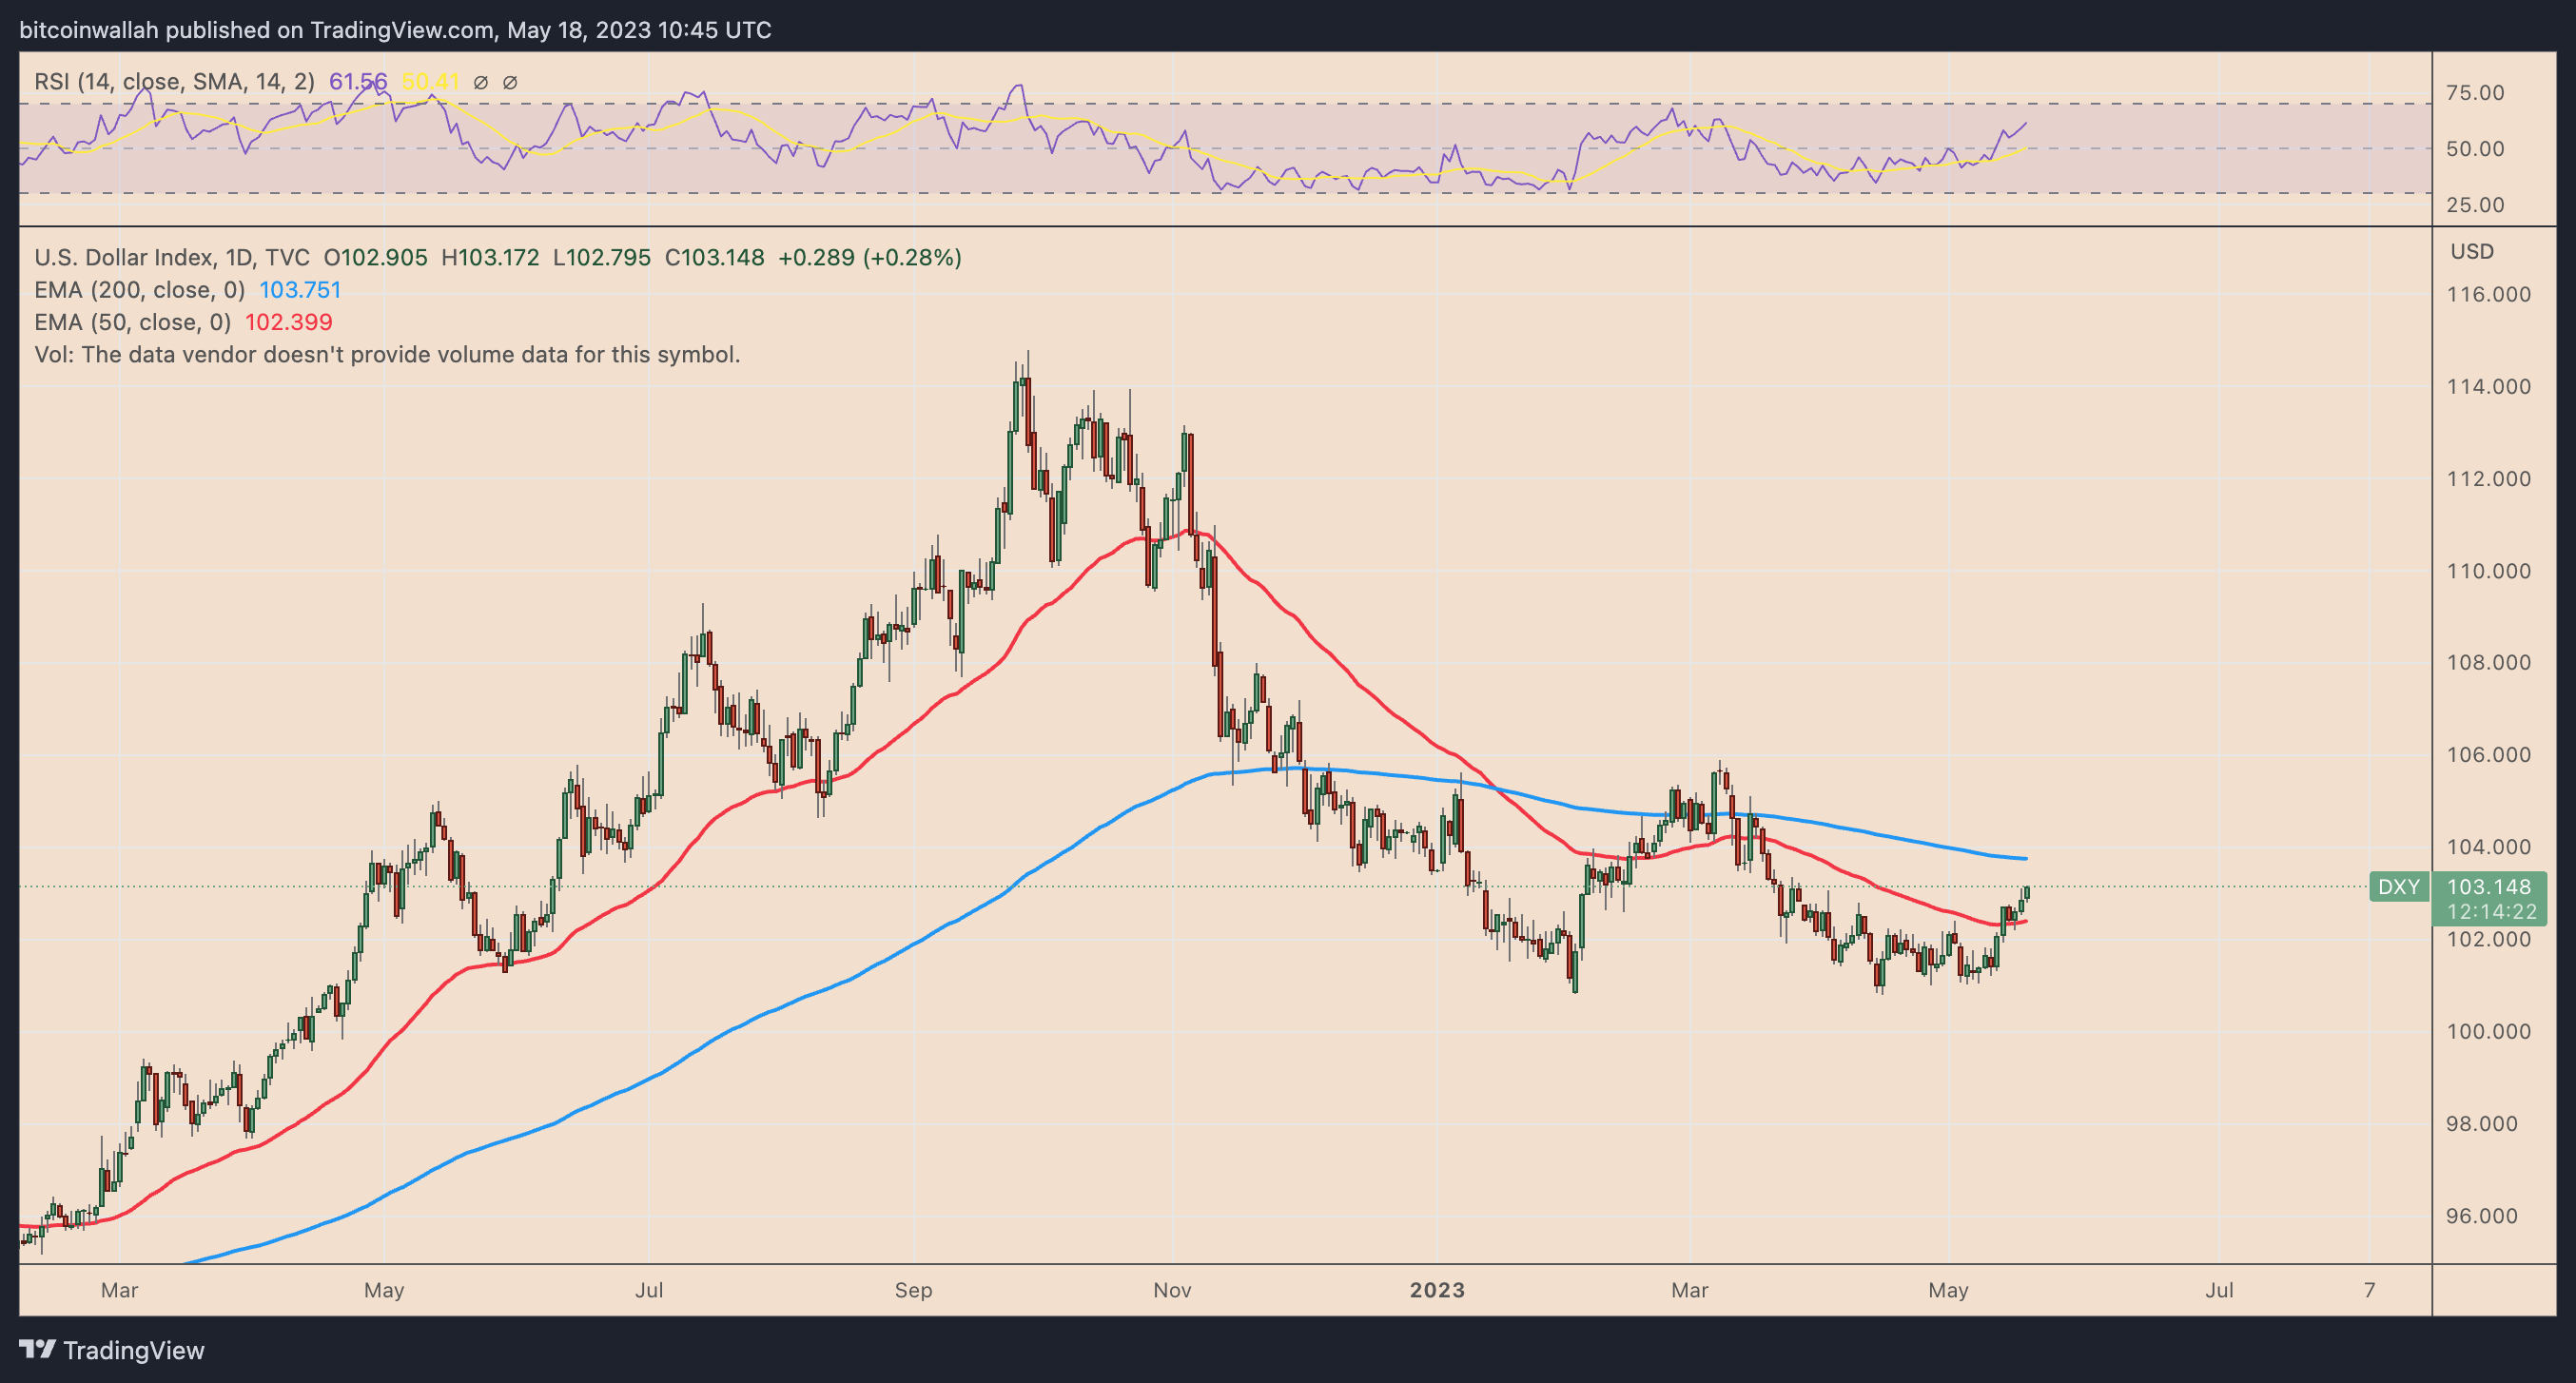
Bitcoin, which typically trades inversely to the greenback, will be in danger if the dollar strength index enters a new bull phase.
BTC price technicals tilt bearish
Bitcoin price chart technicals are likewise painting a bearish target of $25,000, an important psychological price level, by June.
Related: Watch these BTC price levels as Bitcoin threatens to lose $27K support
The bears will argue that Bitcoin faces strong selling pressure from its 50-day exponential moving average (50-day EMA; the red wave) near $27,670.
A pullback from there positions BTC/USD for a drop toward its 200-day EMA (the blue wave) near $24,860.
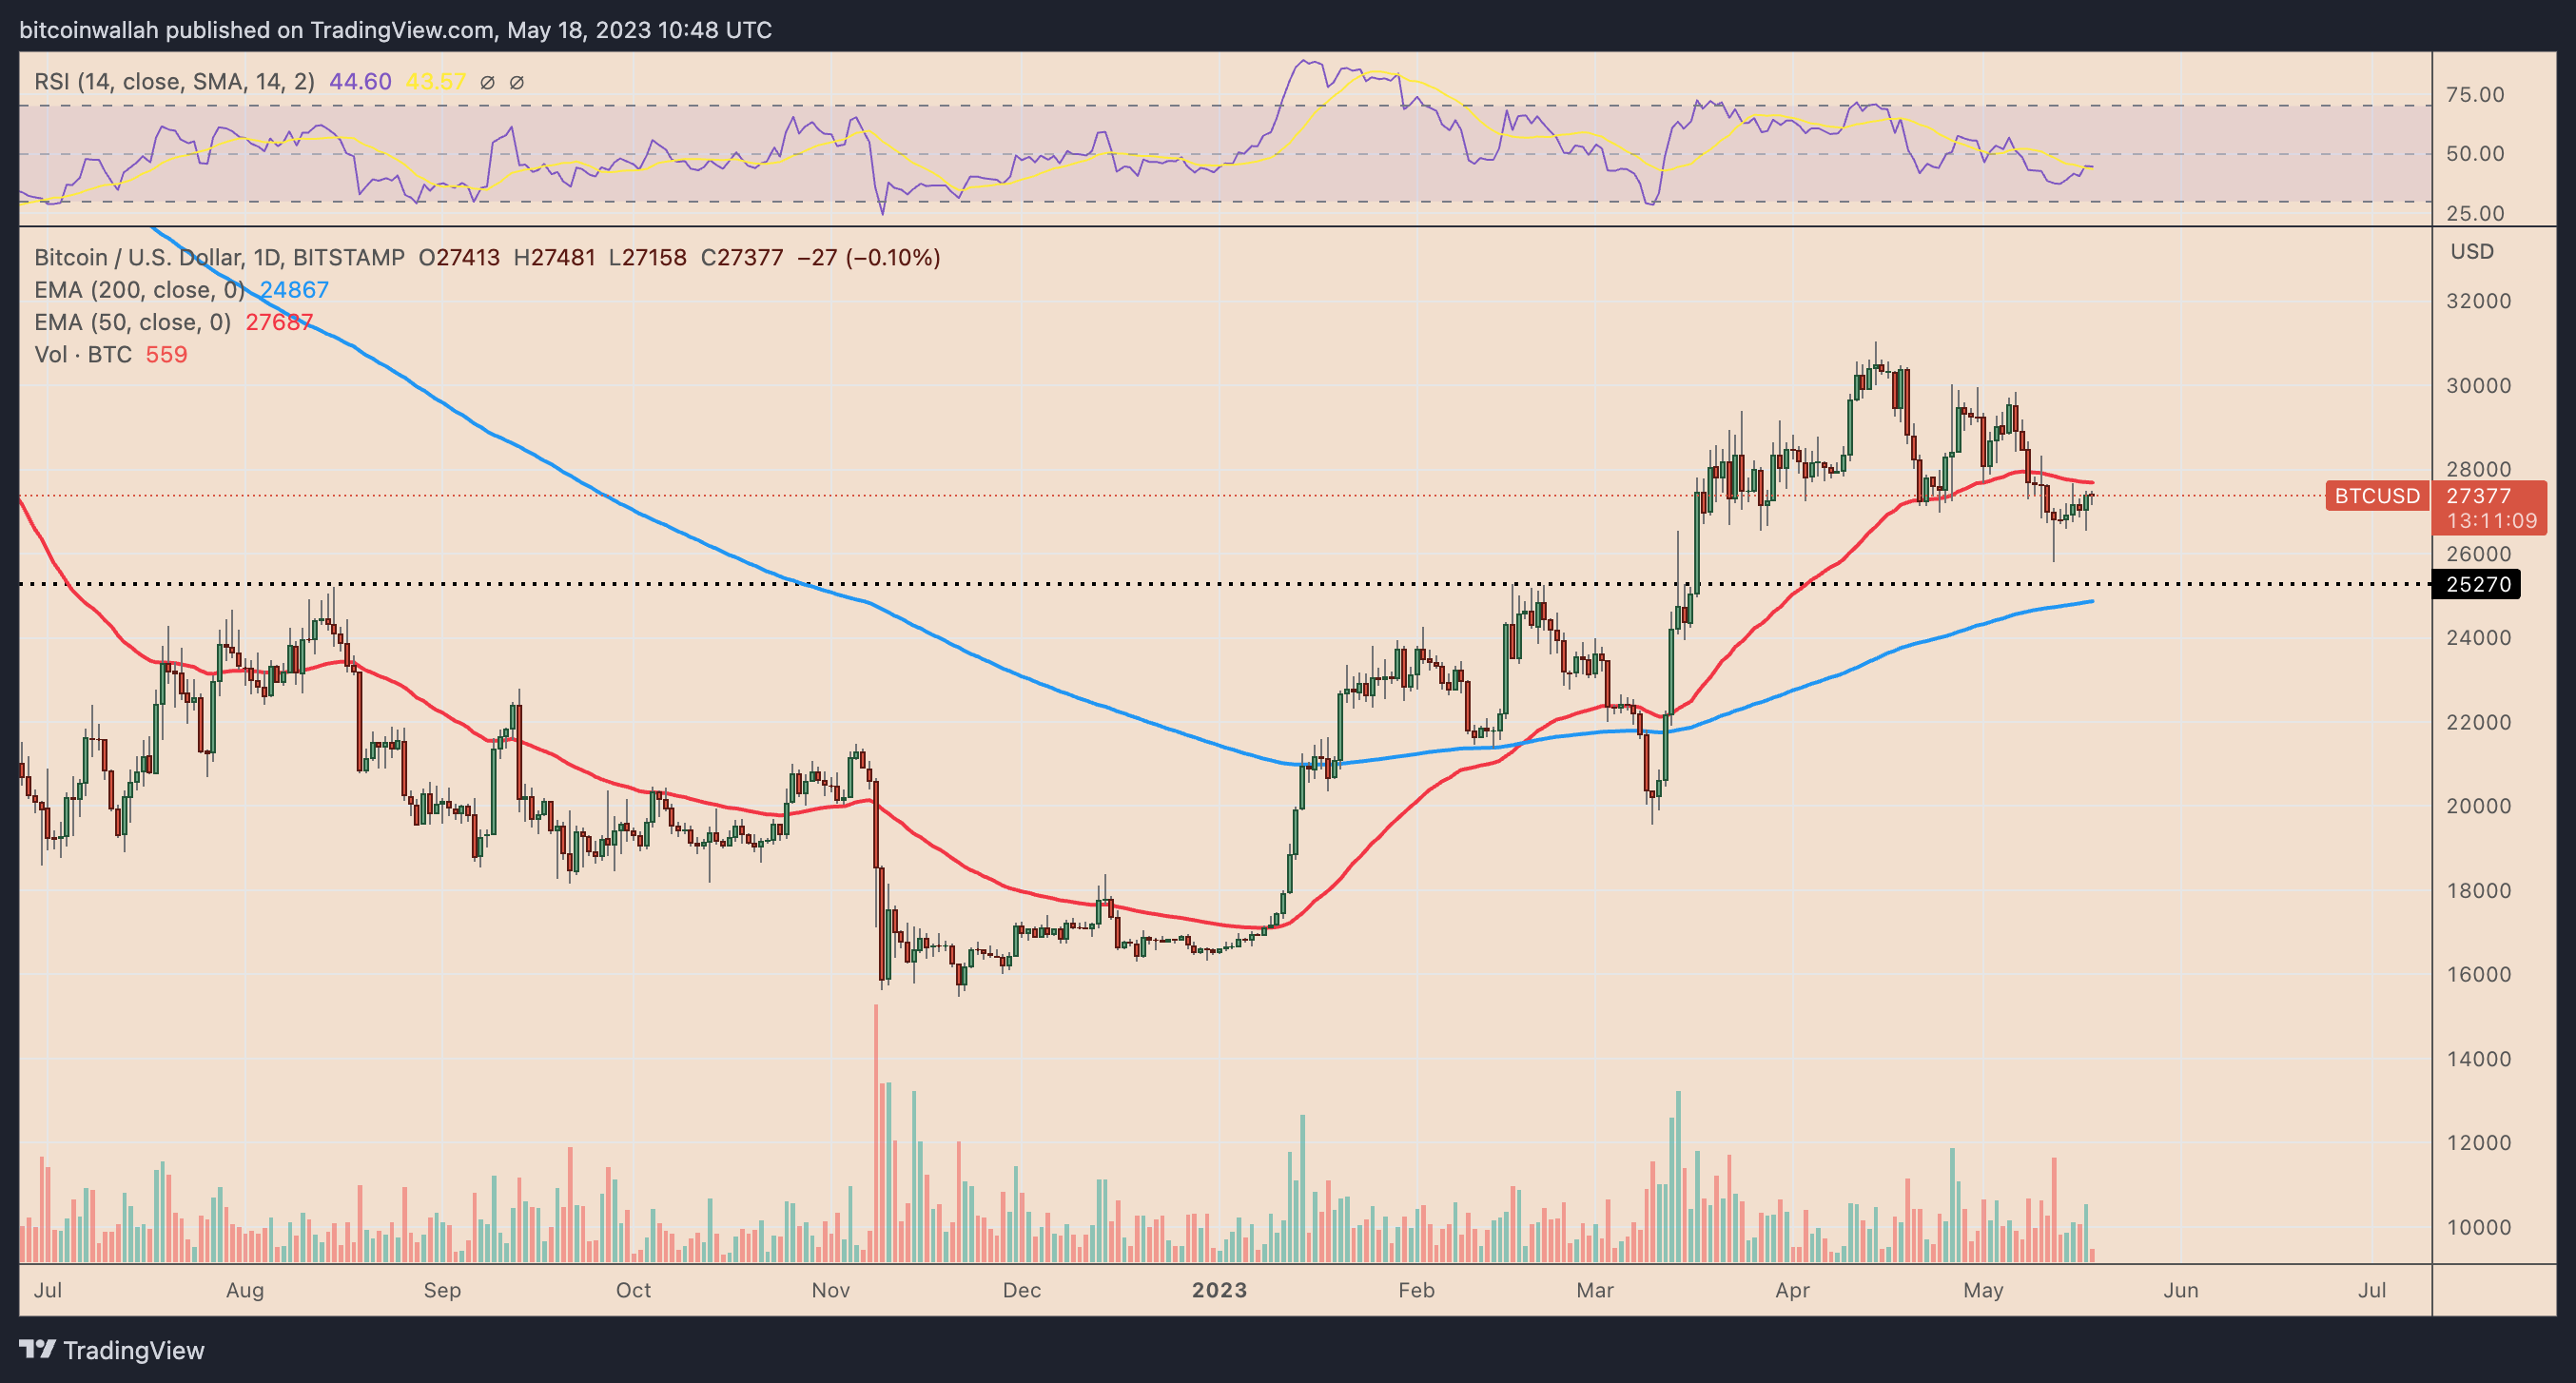
Conversely, a move above Bitcoin's 50-day EMA could invalidate the bearish setup while setting BTC price on the course toward $30,000 by June.
This article does not contain investment advice or recommendations. Every investment and trading move involves risk, and readers should conduct their own research when making a decision.