Bitcoin price analysis shows that Bitcoin opened today’s trading session on a bullish note, trading at around $26,944.04. The 20-day exponential moving average (EMA) also supports the BTC/USD pair and stays above $26,000 for most of yesterday’s session. Bitcoin price is hovering near the $27,000 resistance level, and bulls are looking for a breakout to propel BTC toward its next target of $28,000.
BTC/USD daily chart analysis: BTC price stalls near $27,000
Bitcoin price analysis on the daily chart shows Bitcoin’s price tapped an intraday high of $27,150.98 but has lacked enough momentum to break past the $27,000 resistance level. The 50-day simple moving average (SMA) and the 200-day SMA line remain above the 20-day EMA line, which suggests that the Bitcoin price is in a strong uptrend.
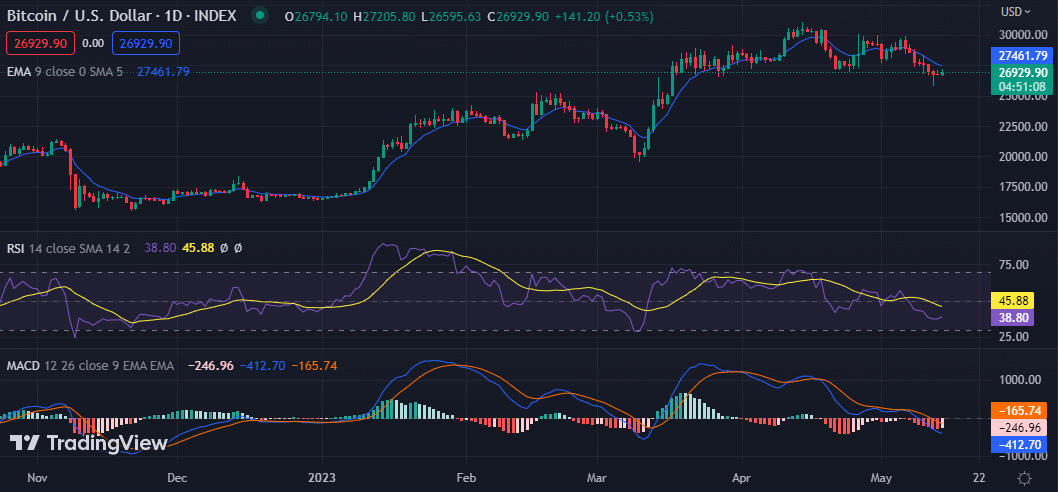
The price seems stuck at the $26,900 level, with bulls and bears in a tug-of-war. The relative strength index (RSI) also suggests that the market is in bullish territory, but it has remained below the 70-level since yesterday’s trading session.
If bulls can muster enough buying pressure to break past the $27,000 resistance level, BTC could see an upsurge toward its next resistance level of $28,000. On the other hand, failure to break the $27,000 resistance sees Bitcoin price fall back towards the $26,660 support level. A break below this level could see BTC tumble down toward its next support of $25,700.
BTC/USD 4-hour chart analysis: BTC forms an ascending triangle pattern
Bitcoin price analysis on the 4-hour chart shows BTC is forming an ascending triangle pattern, a sign that buyers are looking to push prices higher. The formation of this pattern also suggests that Bitcoin could see an upsurge soon.
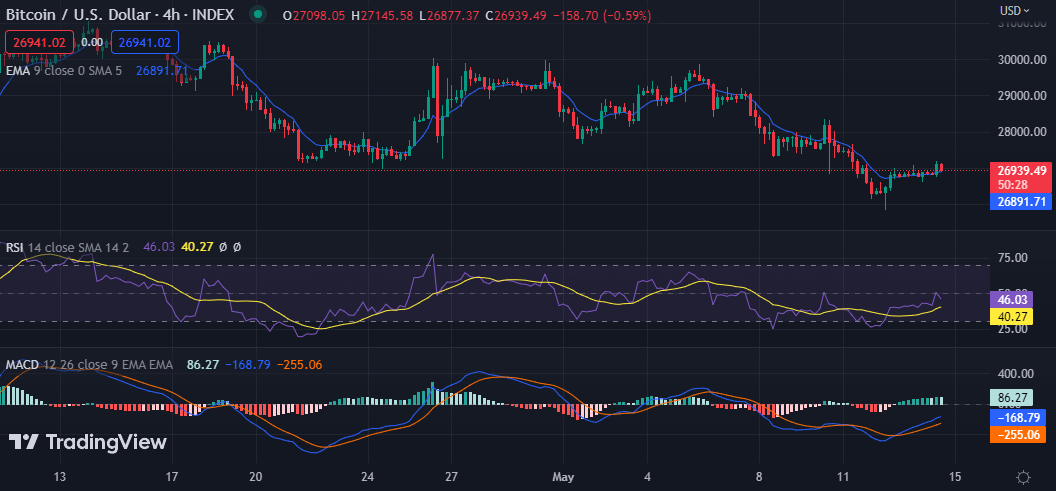
The RSI recently dropped below the 50-level, but it remains in bullish territory, suggesting that bulls have the upper hand in the market. If buyers break past the $27,000 resistance level and further sustain their gains above this level, Bitcoin could surge to its next target of $28,000 over the next few days. On the other hand, failure to break past the $27,000 resistance could see BTC fall back. The MACD line has positioned itself above the red signal line, suggesting a bullish breakout could be imminent. Bitcoin’s candle close above the $27,000 resistance level is needed for a real bullish rally.
Bitcoin price analysis conclusion
Bitcoin price analysis shows that BTC is consolidating near the key $27,000 resistance level as bulls look to break past this barrier and propel prices towards its next target of $28,000. A strong rejection at this level could see Bitcoin fall back toward its support of $26,660. For now, buyers maintain the upper hand in the market and could soon manage to breach the $27,000 resistance level.