The weekend has started with neutral mode on the cryptocurrency market.
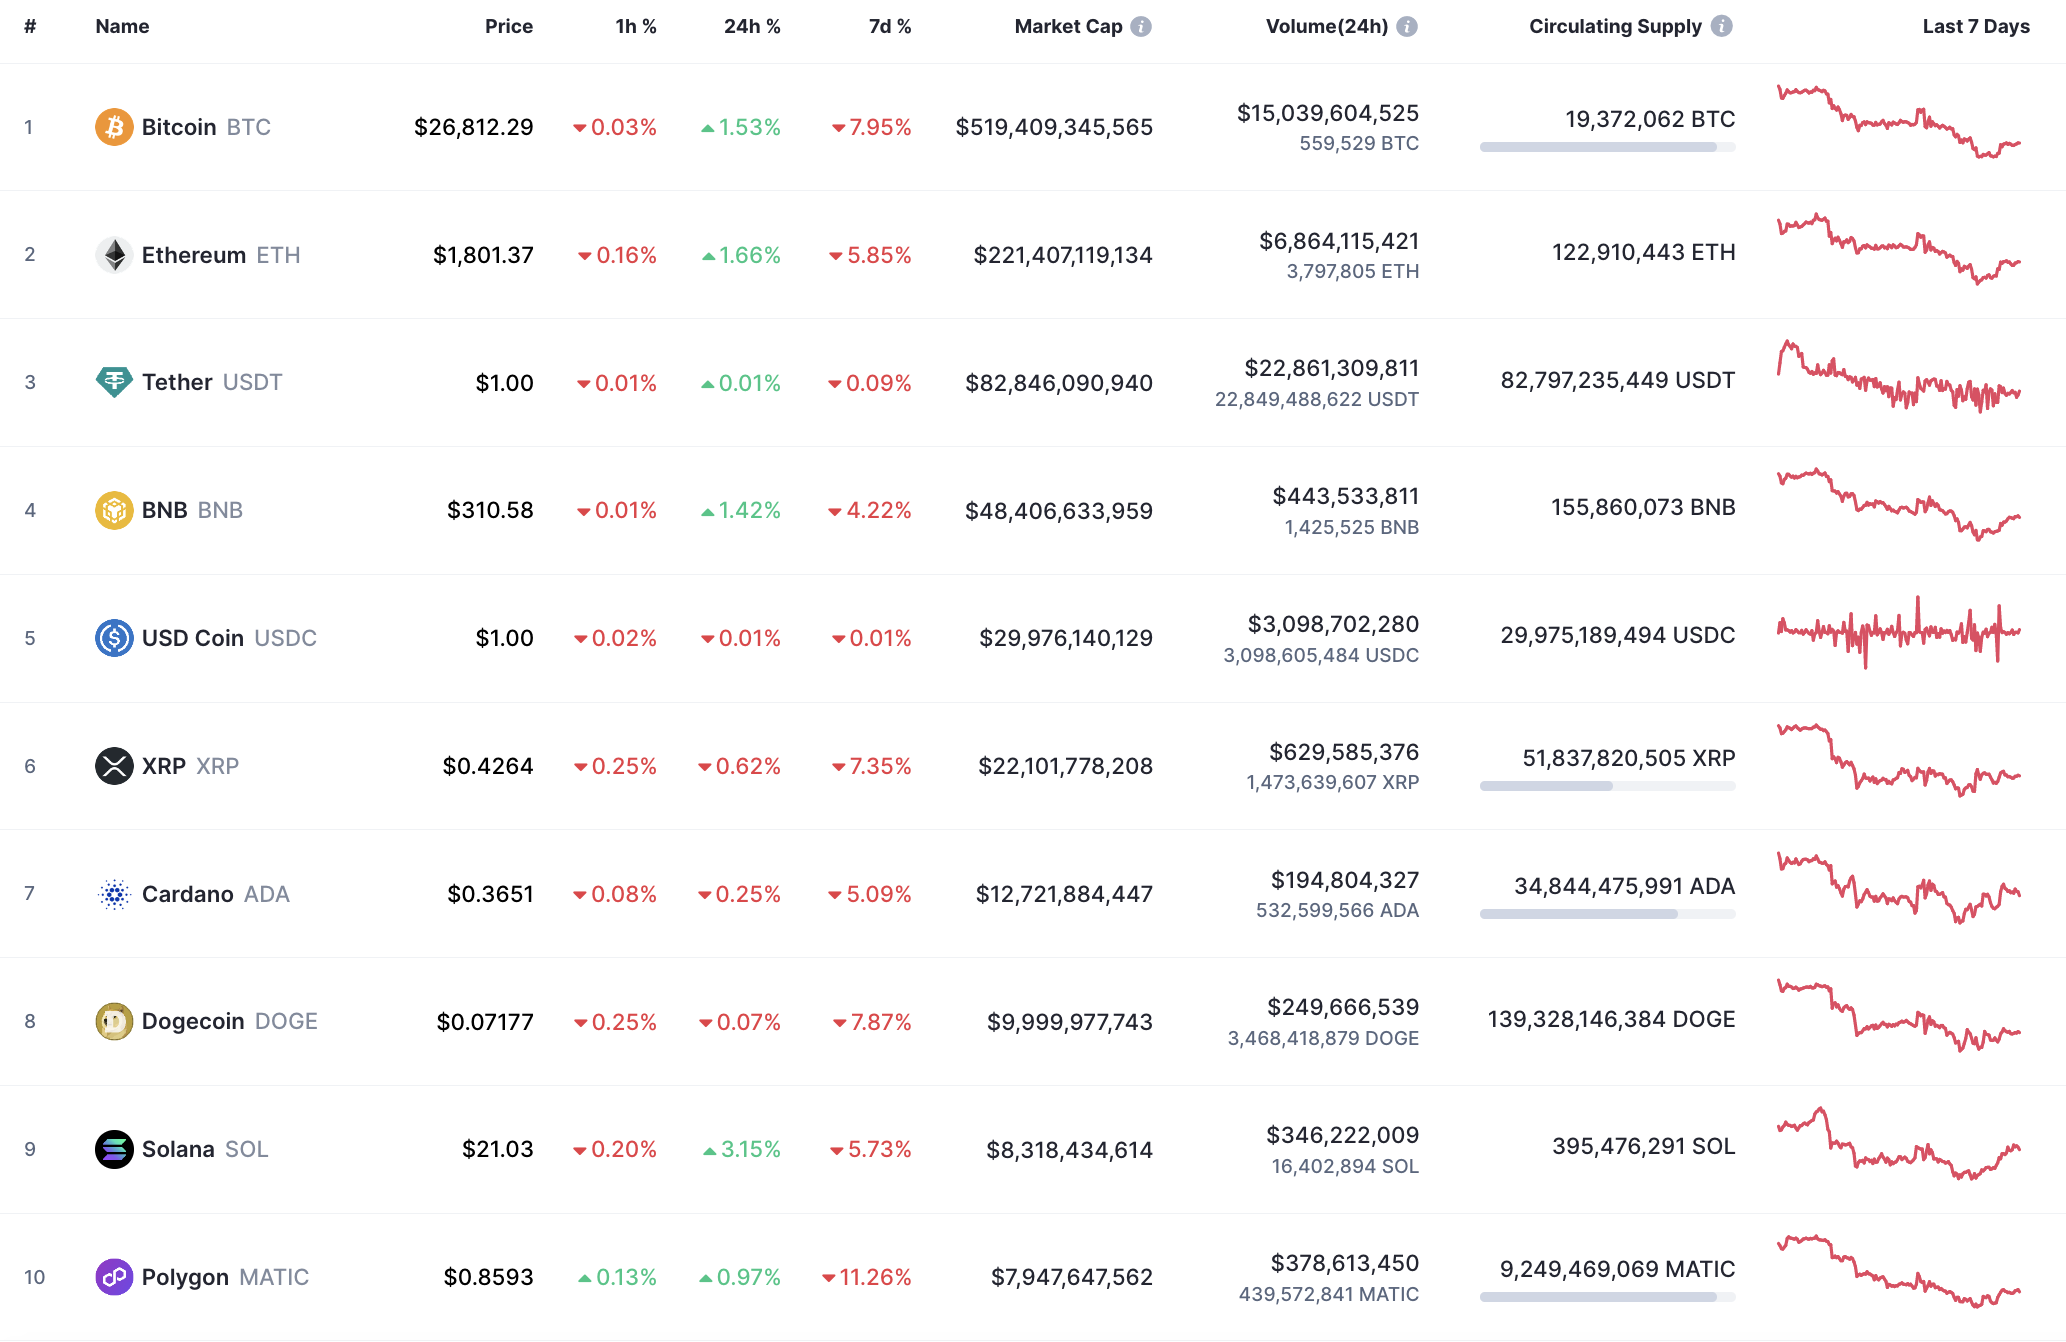
Top coins by CoinMarketCap
BTC/USD
The rate of Bitcoin (BTC) has risen by 1.53% over the last 24 hours.
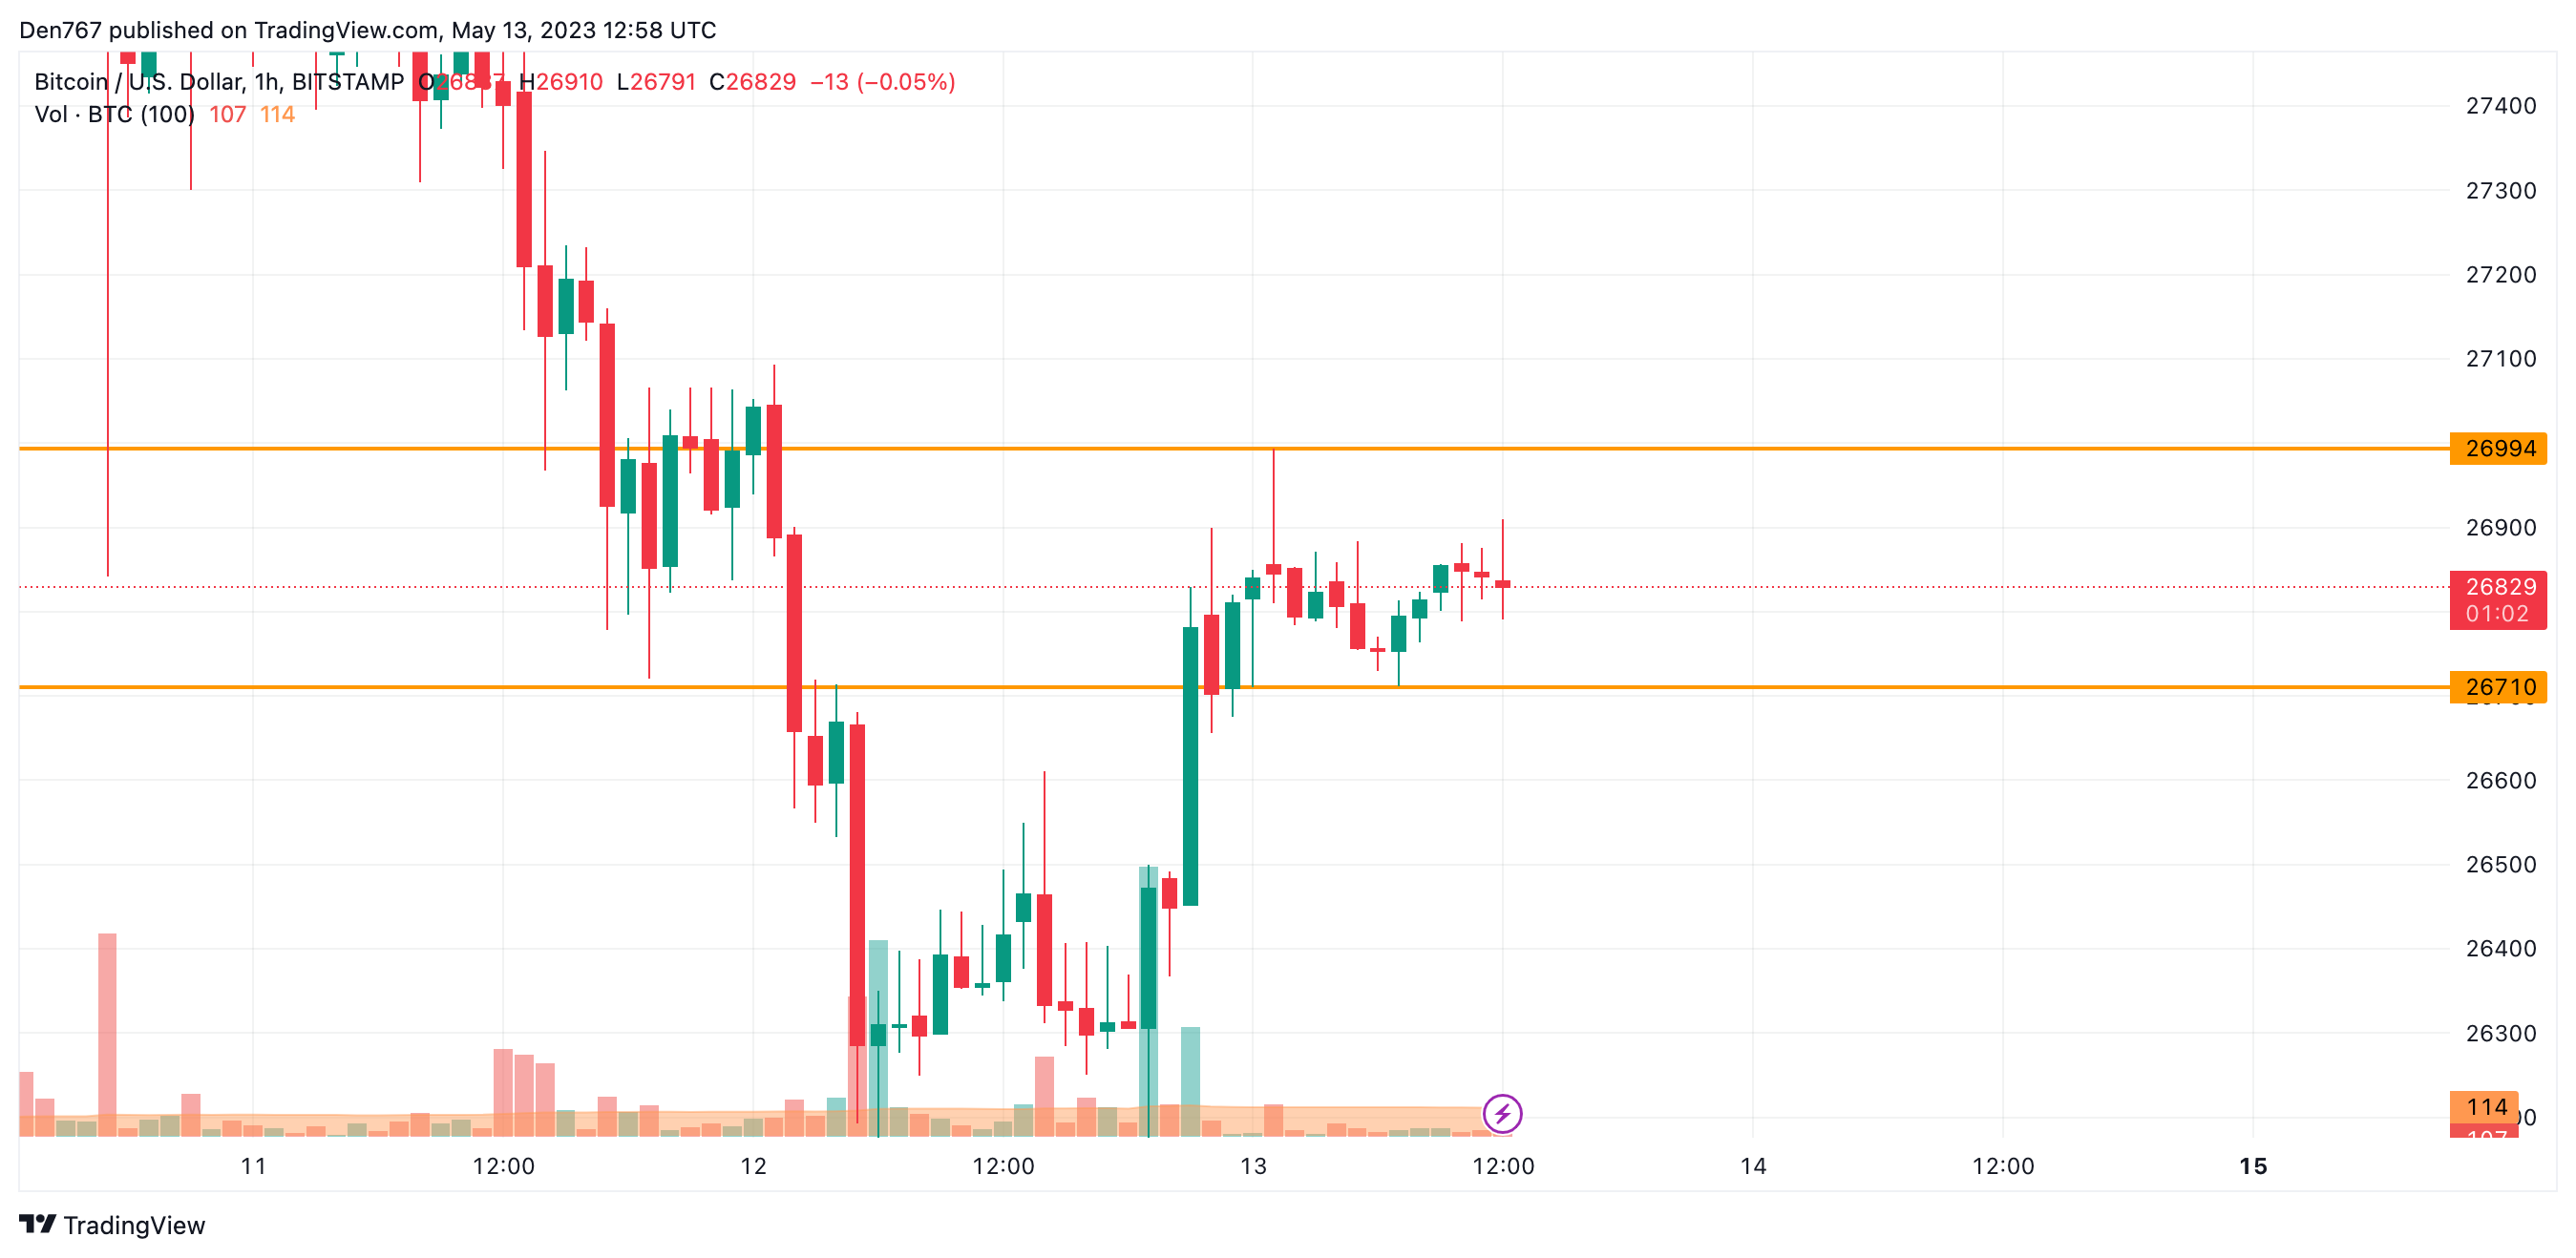
Image by TradingView
On the hourly chart, Bitcoin (BTC) is trading in the middle of the narrow channel between the support at $26,710 and the resistance at $26,994.
If the daily candle closes above the interim mark of $26,900, the accumulated strength may be enough for a continued rise to the $27,000 zone.
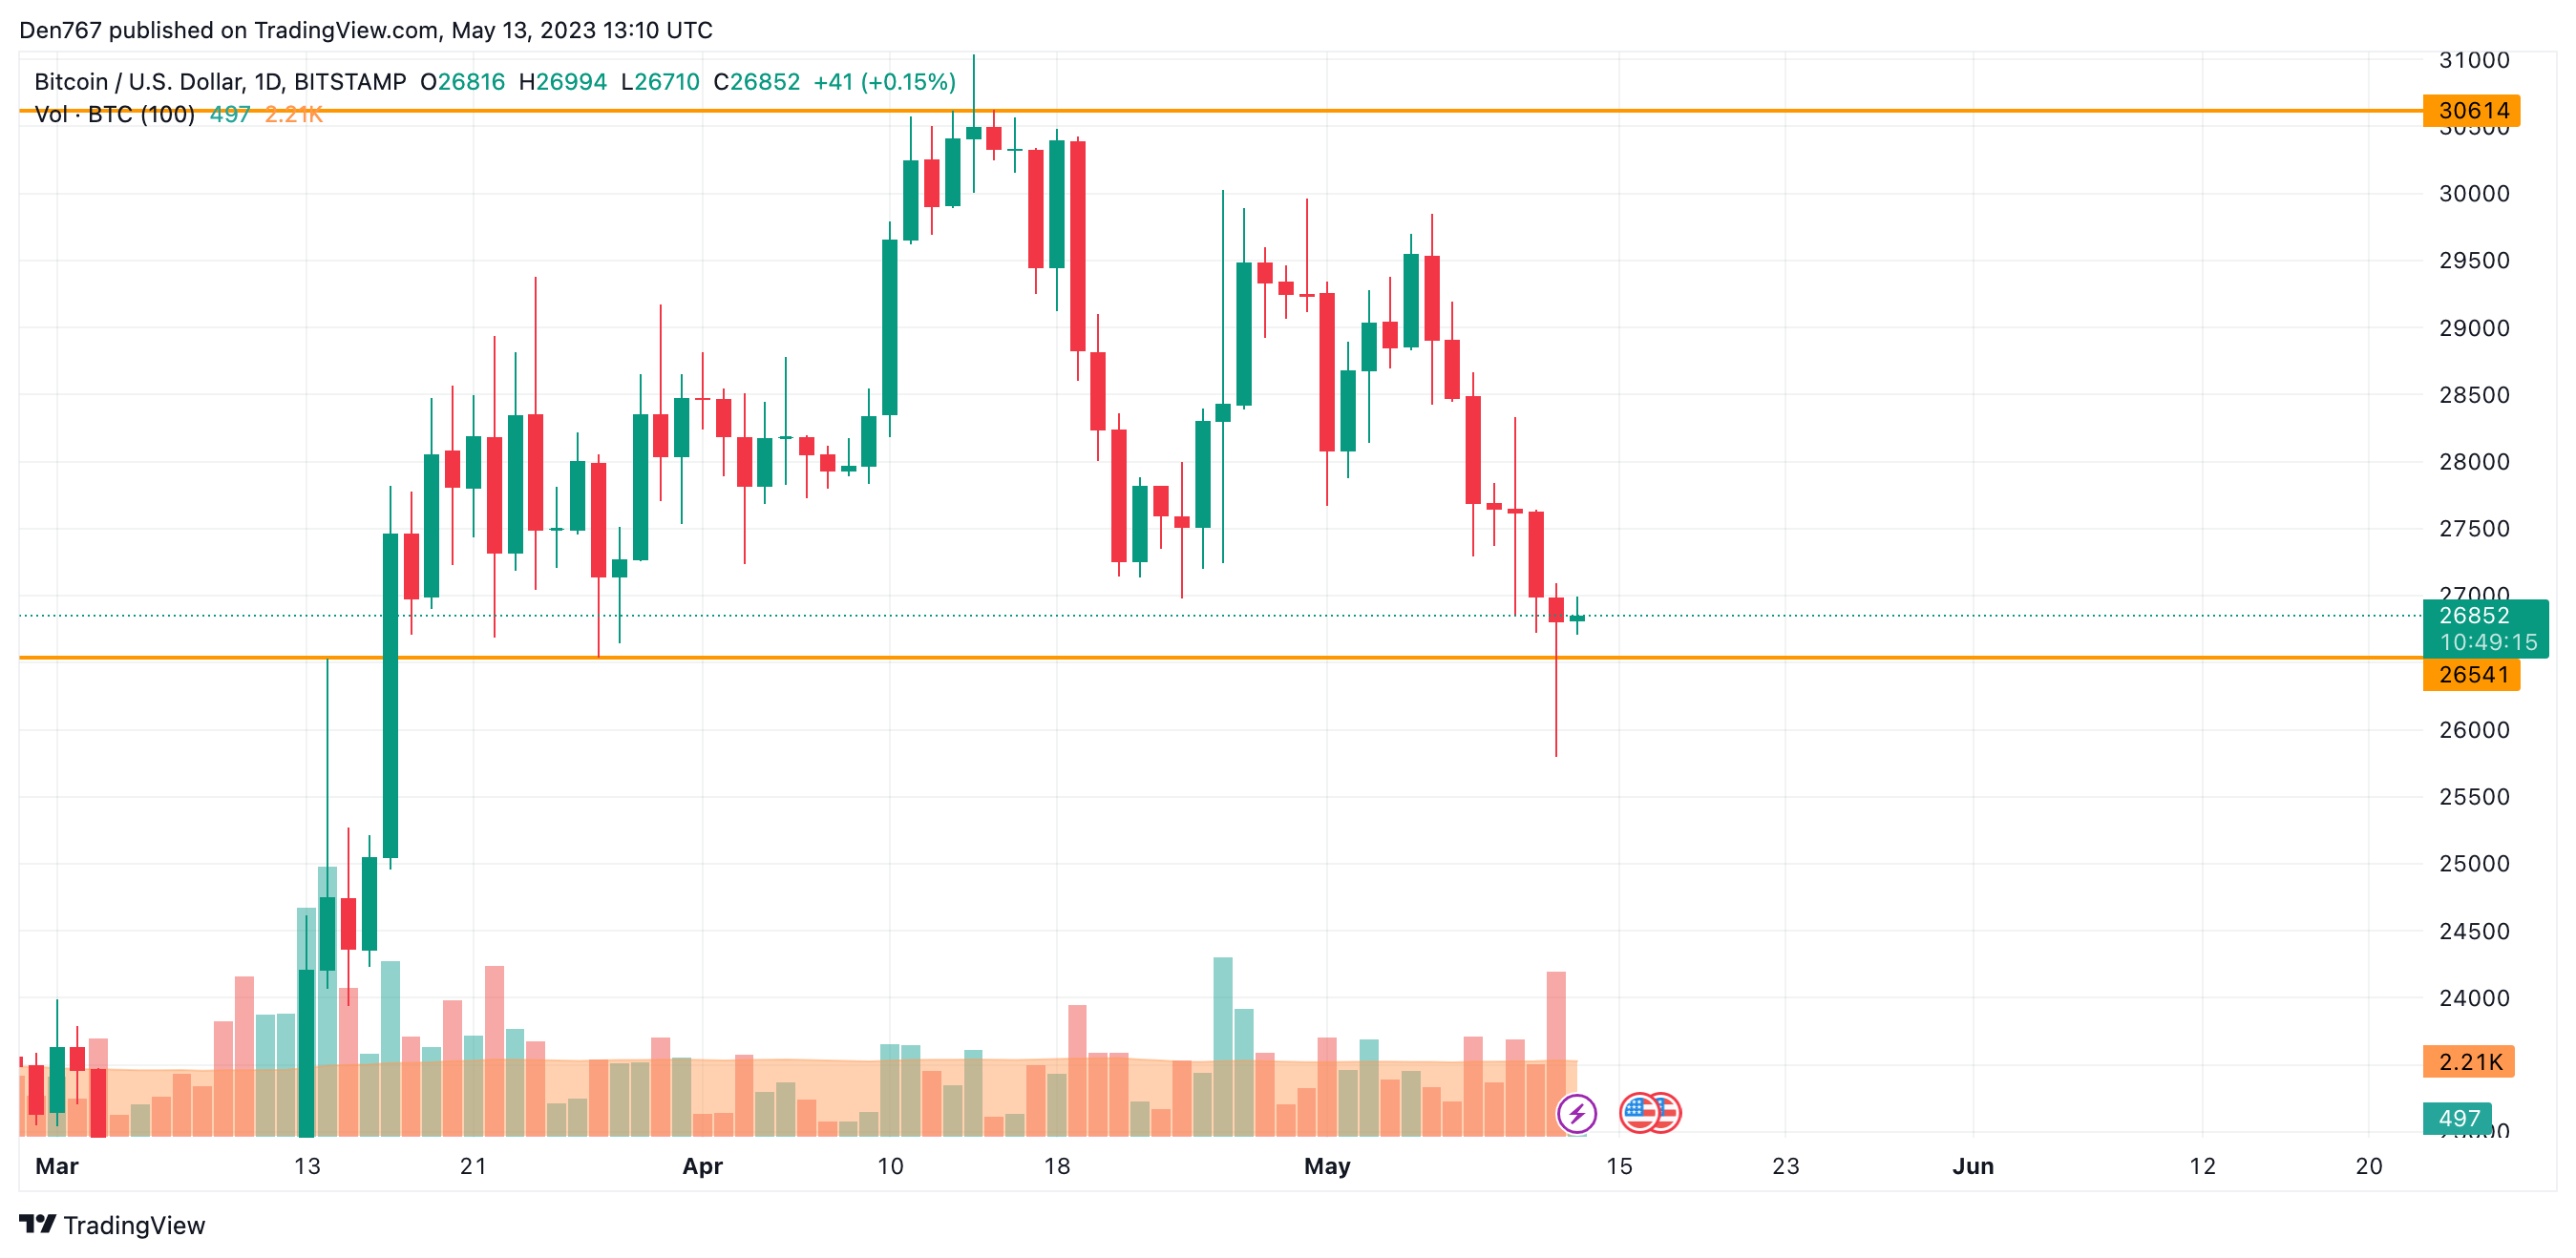
Image by TradingView
On the bigger time frame, the rate of Bitcoin (BTC) has made a false breakout of the $26,541 level. However, sellers' pressure remains relevant as the price could not return above the $27,000 area. If buyers cannot do that shortly, the decline may continue to $26,000 and below.
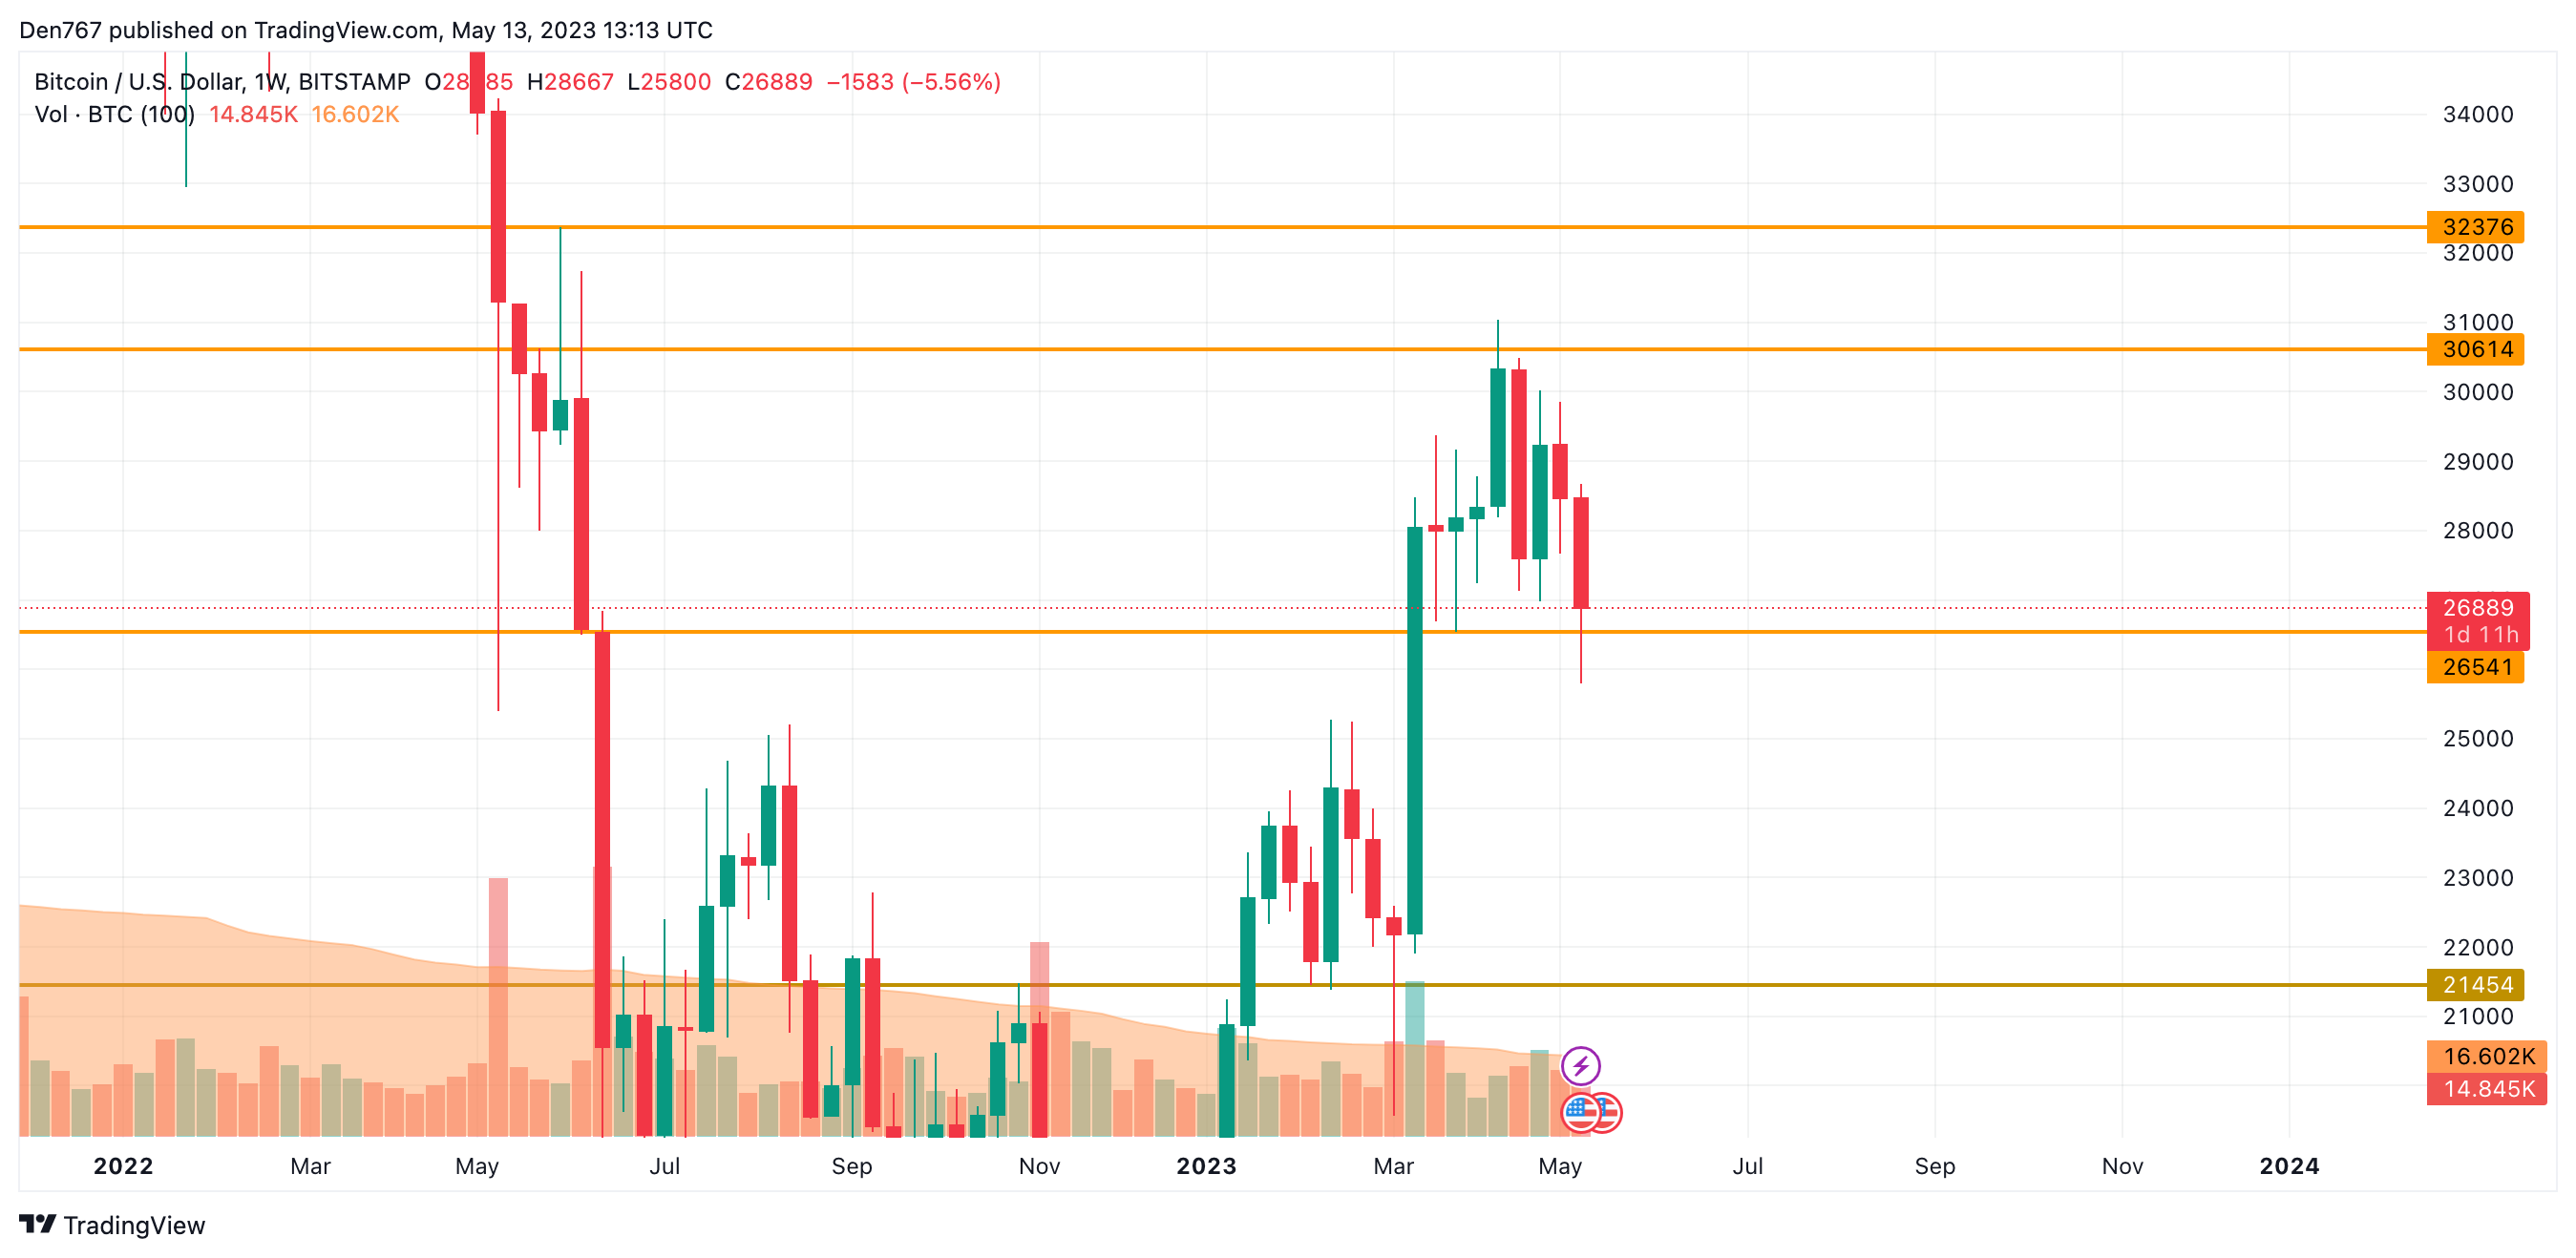
Image by TradingView
From the midterm point of view, traders should pay attention to the bar closure. If it happens far from the level at $26,541, there is a chance to see a bounce back to the $27,000-$28,000 zone by the end of the month.
Bitcoin is trading at $26,887 at press time.