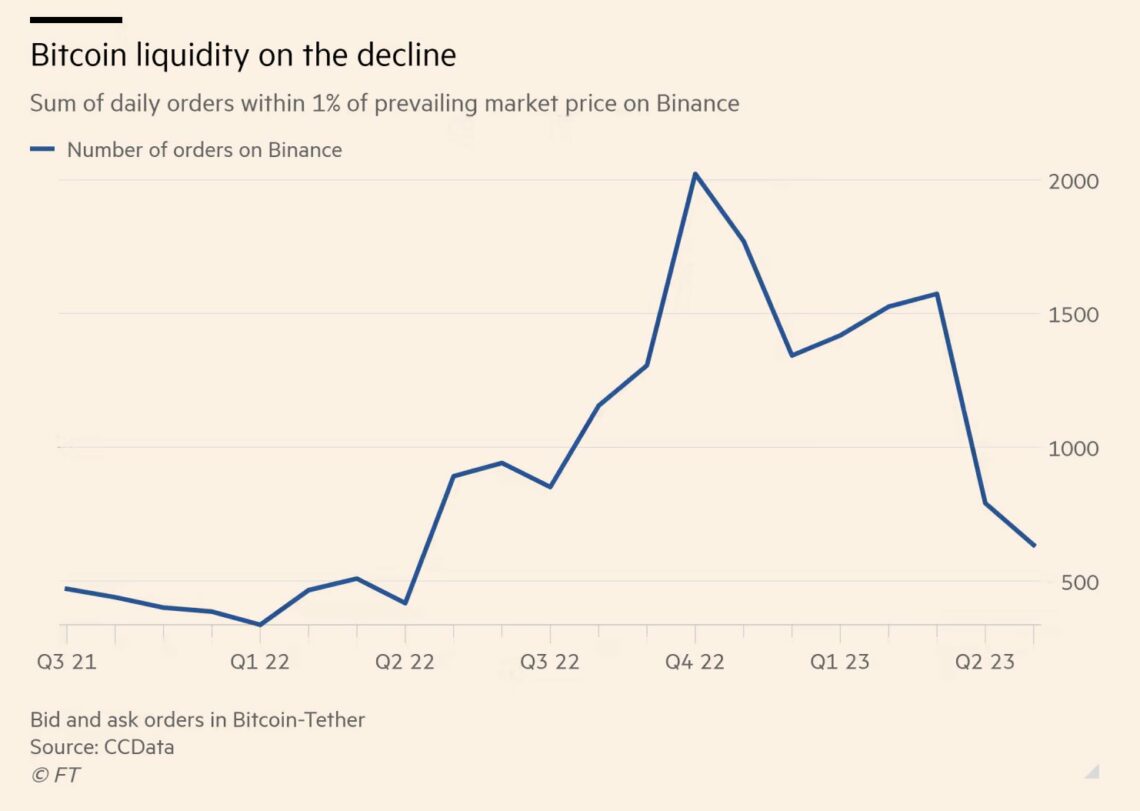
The bear market and the US government’s operation Choke Point 2.0 continue to leave their mark on the Bitcoin market. Liquidity has plummeted in recent weeks and months.
Barchart, a leading provider of real-time intraday charts of equities and commodities, reports today that this trend is currently continuing, with market depth for BTC and the most popular stablecoin in the market, USDT, hitting a new 15-month low.
Market depth refers to the market’s ability to absorb large market orders without significantly affecting the price. The metric takes into account the total size and volume of open orders, bids and offers.
At the end of April, according to CCData, it would have taken an order of just 462 BTC to move the asset’s price by at least 1% in either direction. According to Barchart, this is the lowest market depth for BTC-USDT since May 2022, when the leading cryptocurrency took a massive tumble in the wake of the COVID crash.
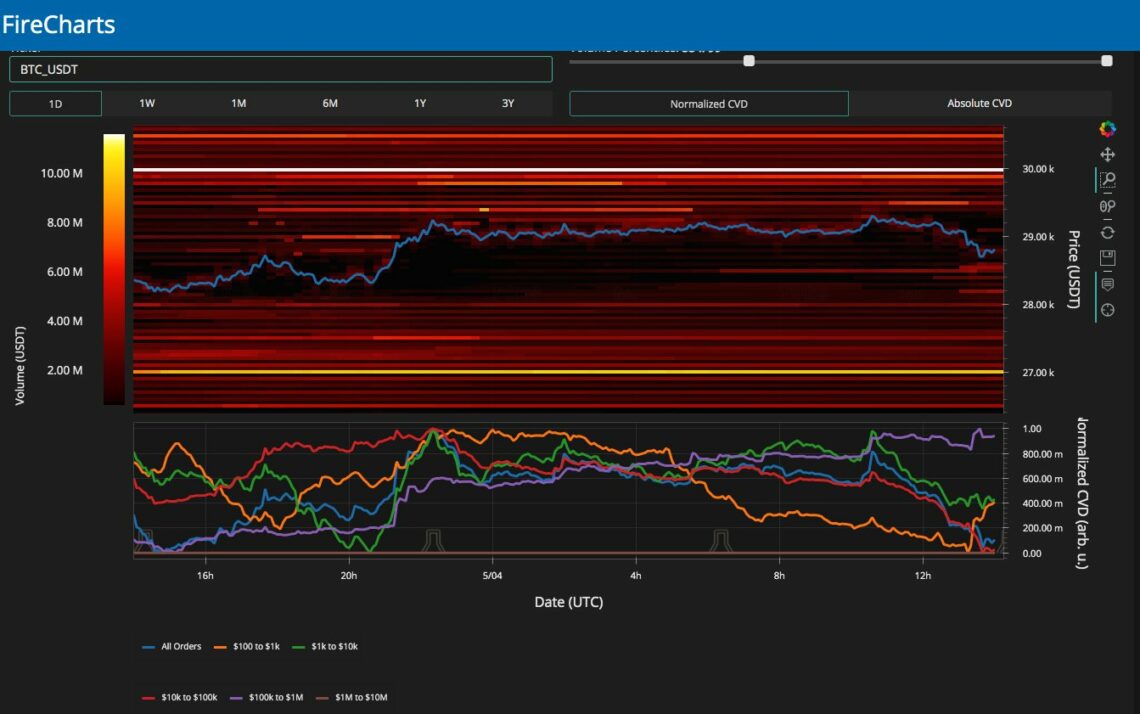
Market data provider Material Indicators shared a chart yesterday showing that Bitcoin whales are currently forced to split their large buy and sell orders into smaller orders due to high slippage resulting from low liquidity.
“If you are wondering why yellow is buying BTC here and brown mega whales haven’t, it’s not likely retail vs smart money. It’s because liquidity between here and $29.1k is so thin that the slippage on a whale sized order would be significant so they are literally forced to make smaller orders,” the experts explained via Twitter, sharing the chart below.
Bitcoin Stronger Than Last Bear Market
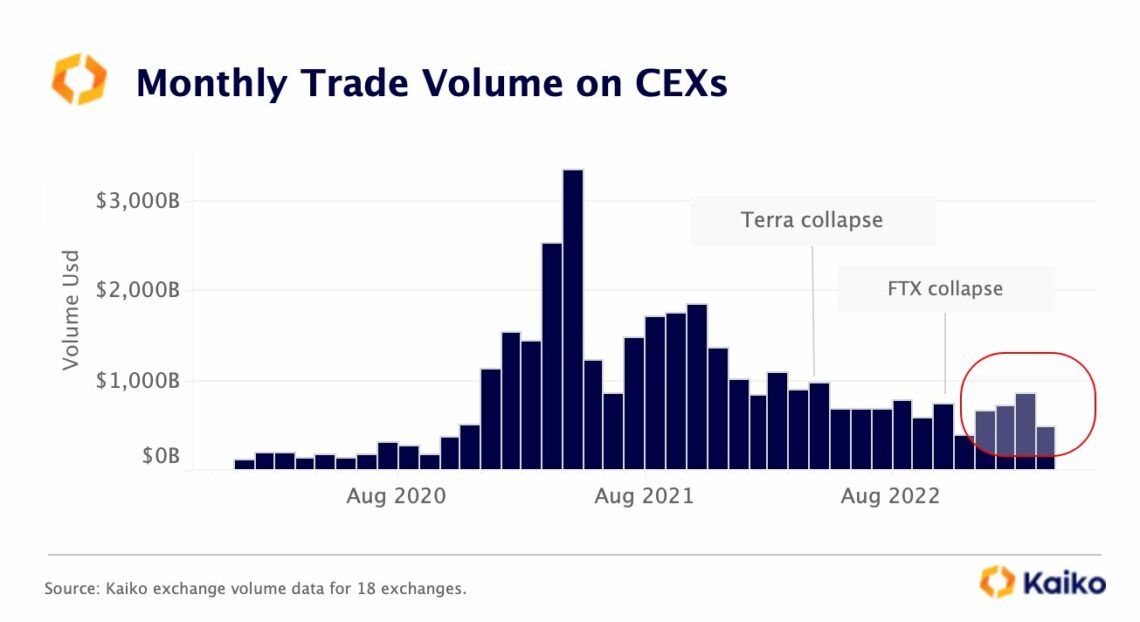
The data provider shared similar data recently, although it also offers a glimmer of optimism. Two days ago, Kaiko said that trading volumes on the central exchanges declined in April after rising for three straight months and surpassing pre-FTX levels in March.
On the bright side, however, the crypto market as a whole is significantly larger than it was before the 2020 bull market. Moreover, quarterly trading volume on Coinbase, the largest U.S. exchange, has stabilized above $140 billion over the past three quarters. Despite this, however, it is still half of the 2021 average.
In terms of liquidity, though, Kaiko also notes a deterioration, with both Bitcoin and Ethereum approaching one-year lows in 2% market depth. One trend Kaiko is currently seeing is that perpetual futures are increasingly driving price action.
“Perp-to-spot volume is the highest it’s been in almost 2 years, and price discovery is taking place in the derivatives markets,” notes Conor Ryder, researcher at Kaiko. On the question of which direction Bitcoin’s price is trending, Ryder states:
There was a huge buildup of long positions mid-April but as soon as funding flipped negative prices topped out. OI [Open Interest] on a downward trend since along with price as funding remains mixed so no clear trend. But the chart shows how futures are really driving prices now.
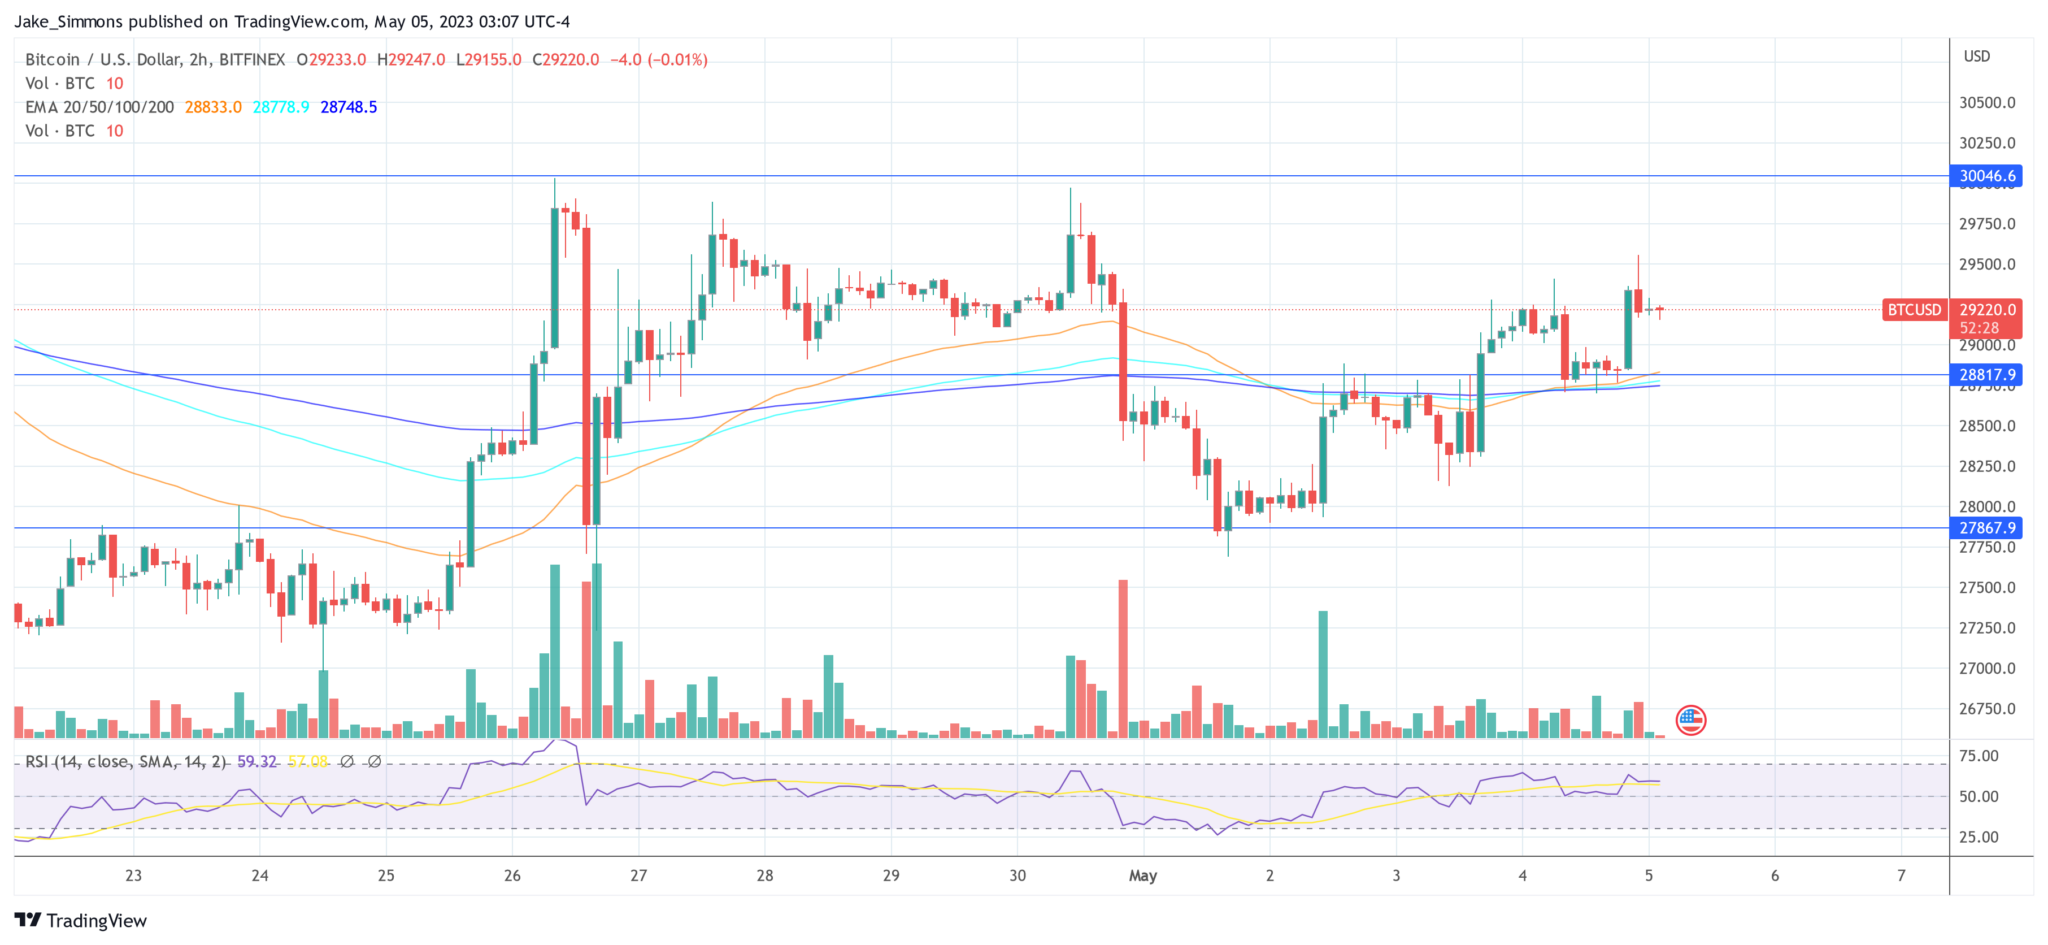
At press time, the Bitcoin price stood at $29,220.