Bitcoin’s overall outlook on the daily timeframe remains bullish as the price recently formed a correction and has found support at the crucial level of the 50-day moving average. Despite these positive aspects, the price now faces significant resistance at $30K.
Technical Analysis
By Shayan
The Daily Chart
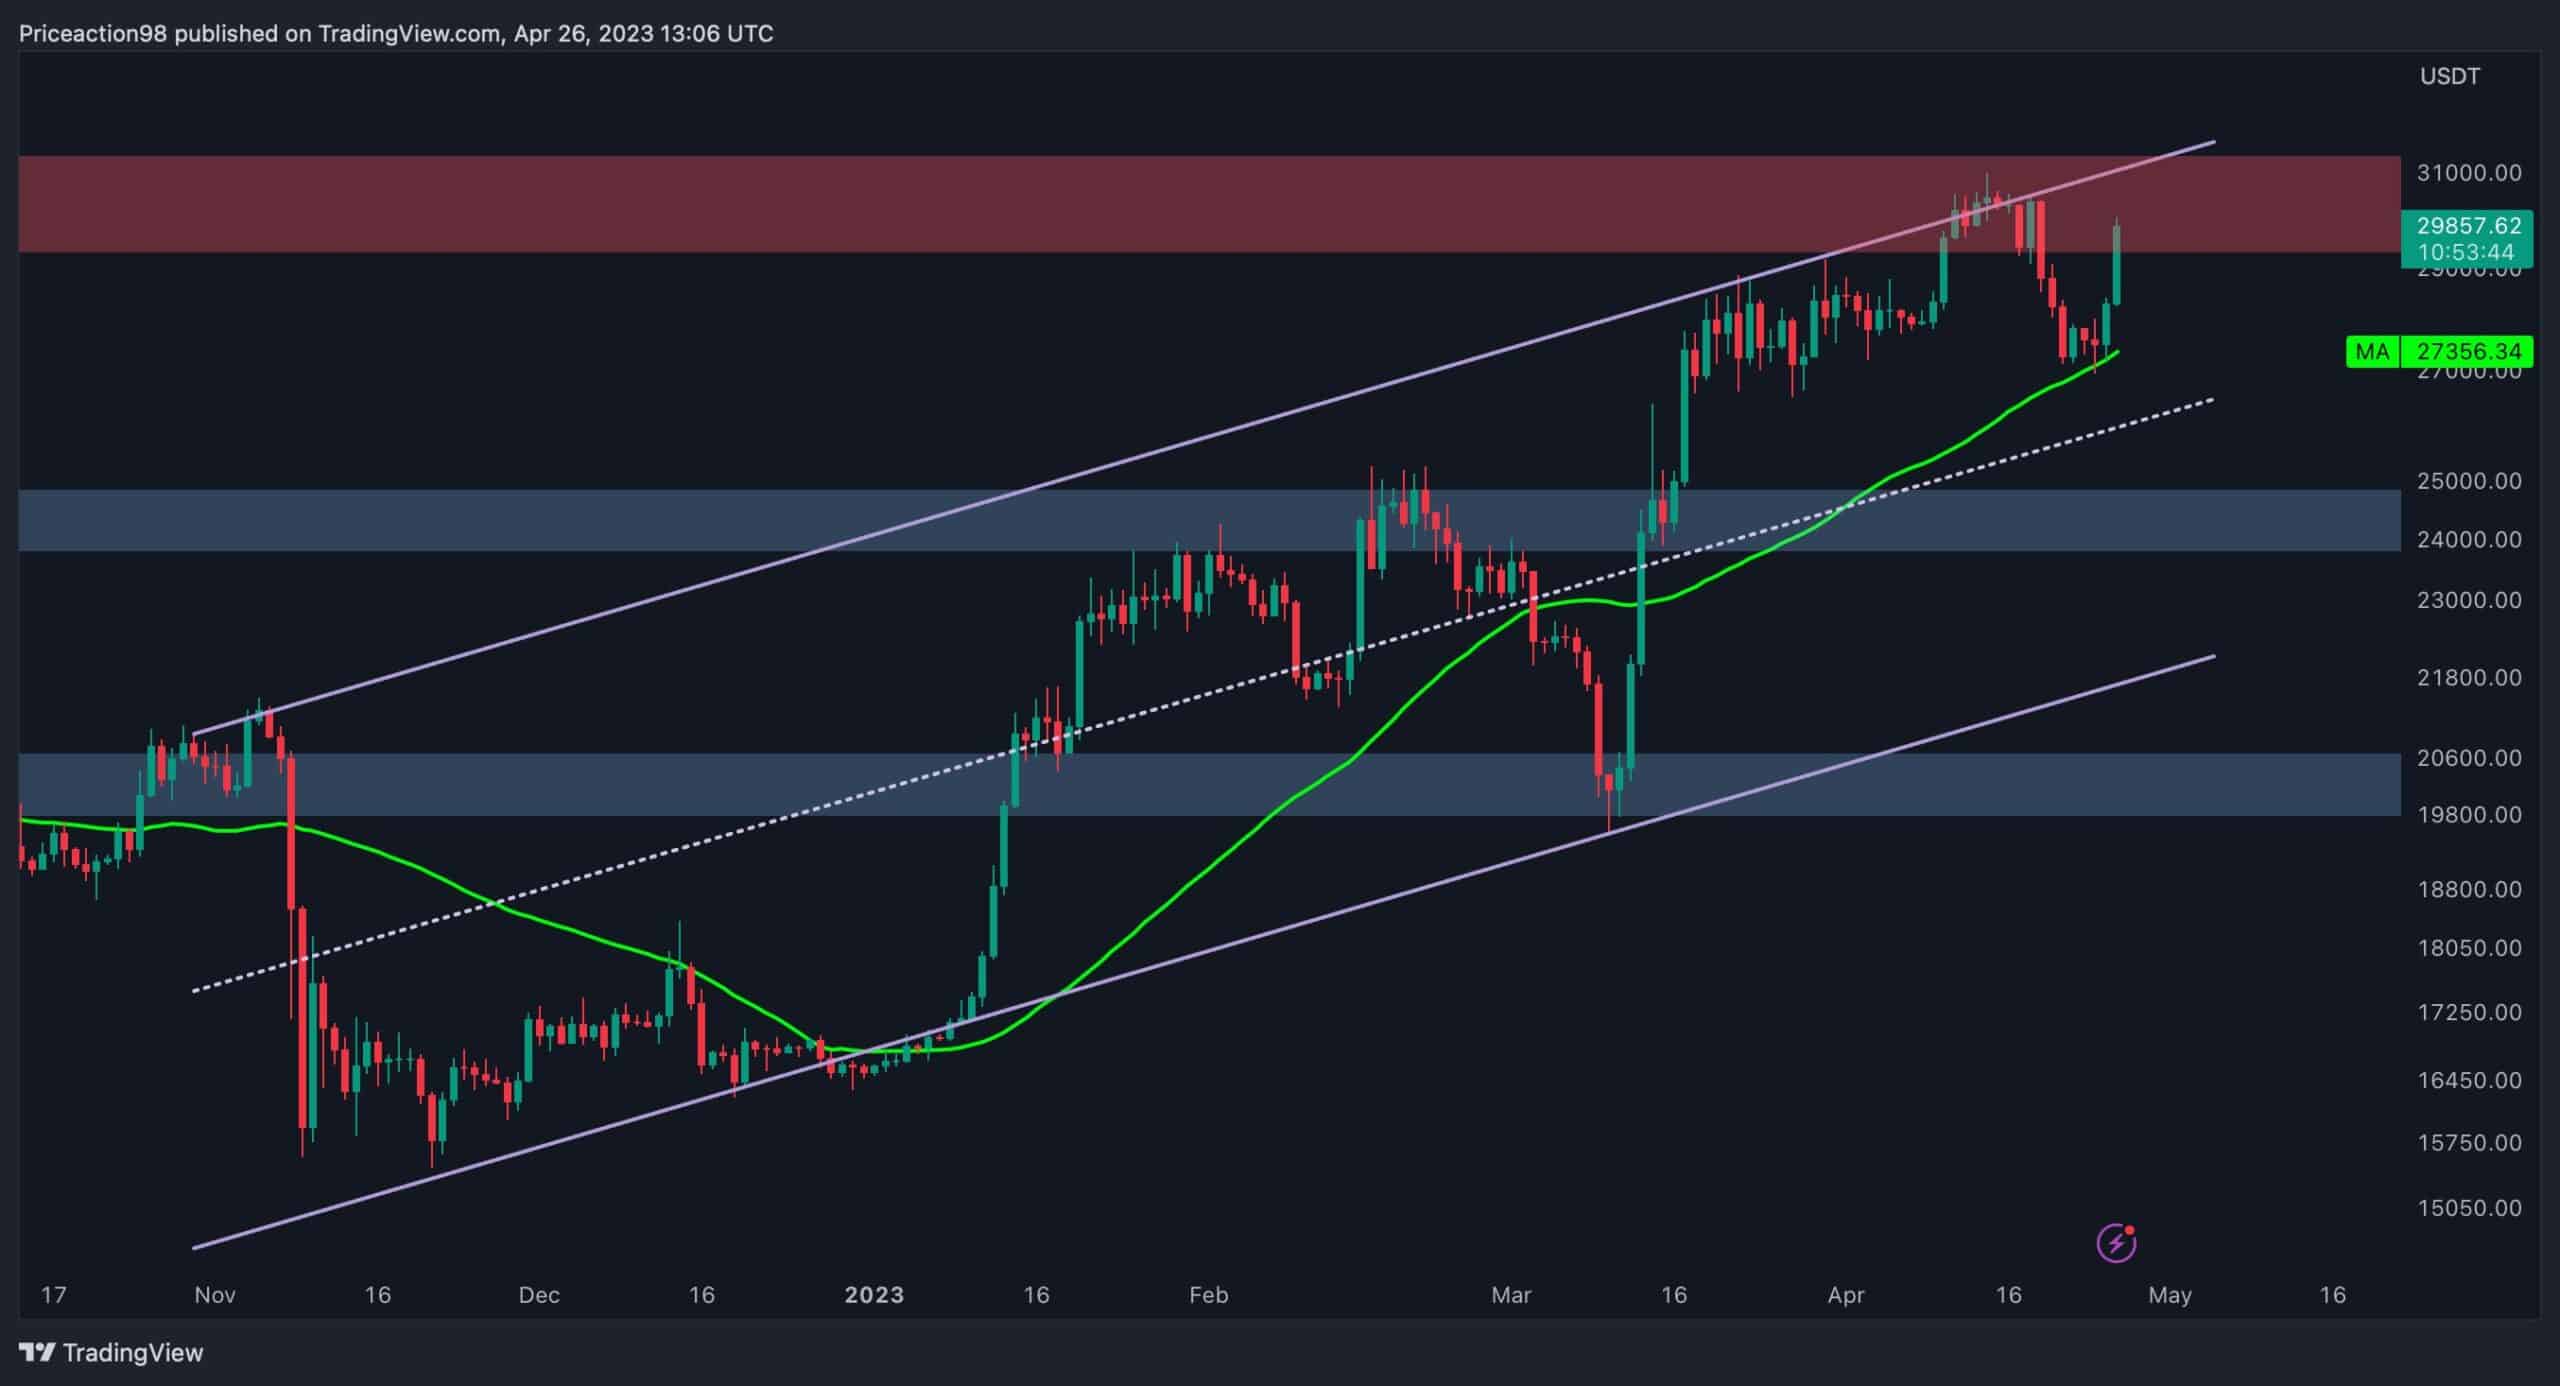
Following a multi-month uptrend, Bitcoin reached the crucial $30K resistance level and failed to maintain above. However, after a short-term correction stage, resulting in a 14% decline, Bitcoin found support at the 50-day moving average of $27.3K.
This led to another uptrend, providing a positive signal for the overall outlook of the cryptocurrency, indicating that bulls are in control. However, BTC is currently facing a significant and decisive resistance level at the $30K price zone and is striving to break out of it.
If successful, it could start a robust bullish rally towards the $40K price channel. On the other hand, if the price fails to surpass this vital level, a double-top pattern will form, potentially leading to another bearish leg.
The 4-Hour Chart
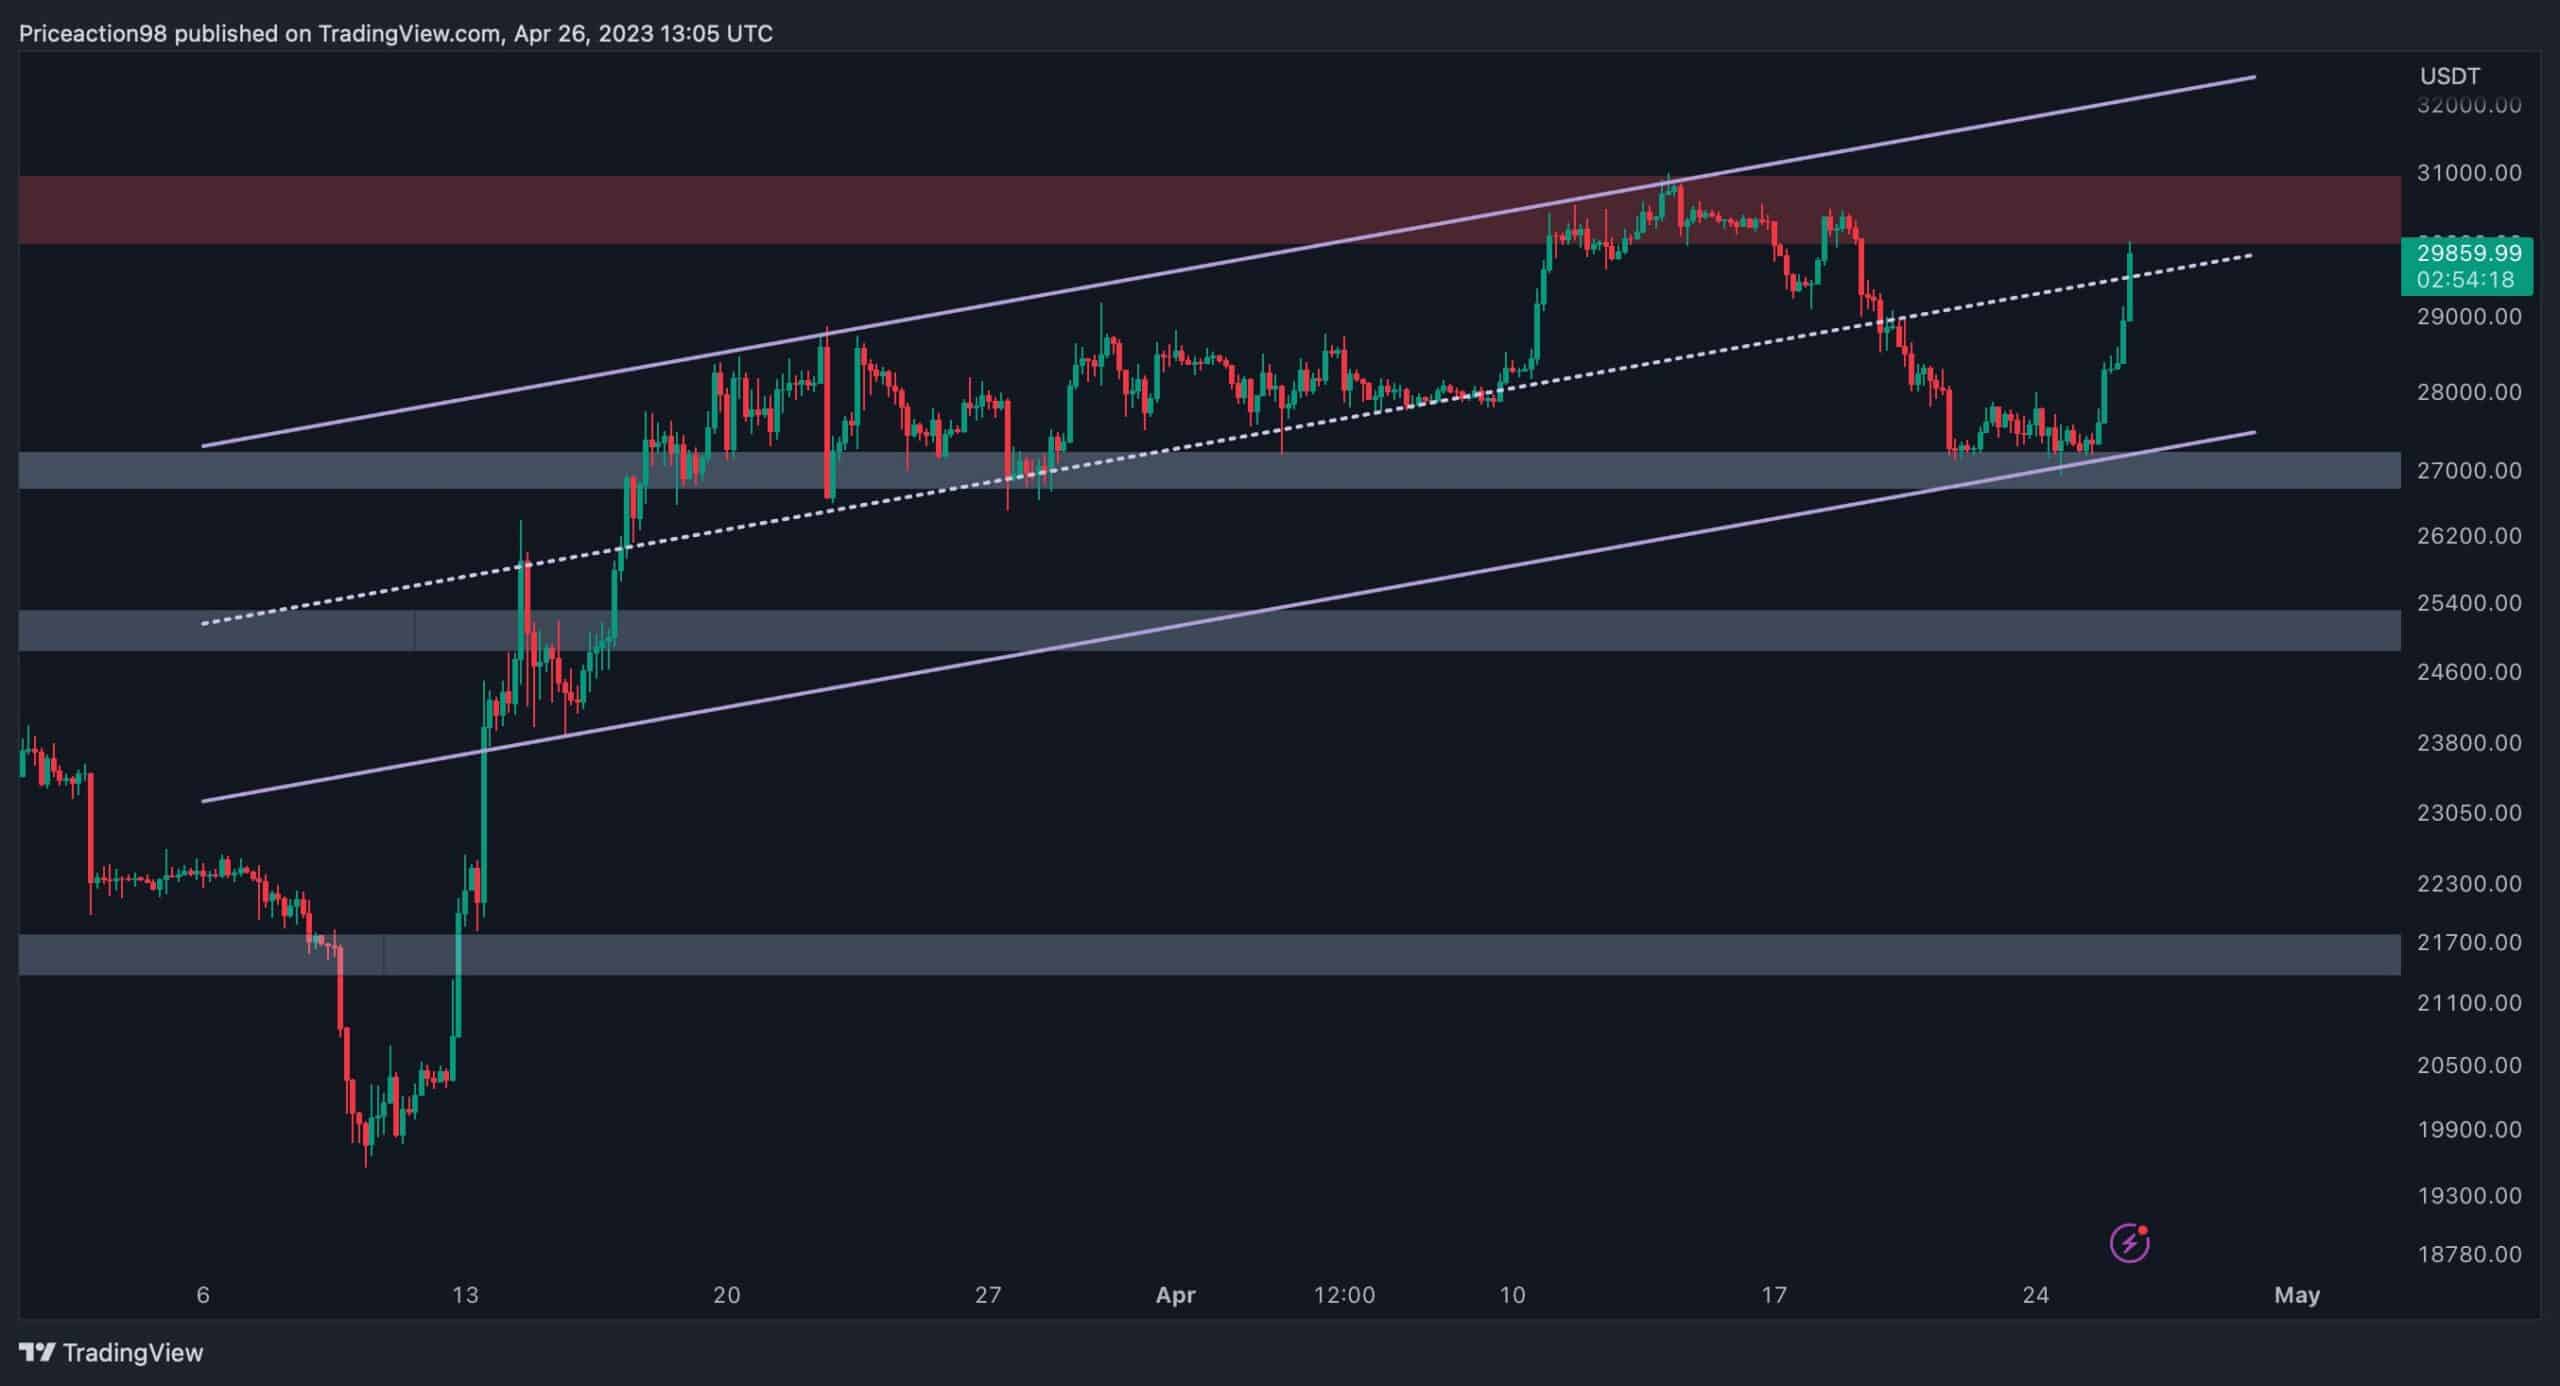
On the 4-hour timeframe, Bitcoin has formed an ascending channel and recently dropped to its lower threshold. However, the trendline and the short-term static support level of $27K protected the price, causing it to surge.
Currently, the cryptocurrency is facing a critical resistance level on the channel’s middle trendline, which will determine its next move. If the price manages to surpass this level, it will aim for the $30K price region. On the other hand, if the trendline rejects the price, there is a possibility of a decline toward the lower boundary and the $27K support level.
On-chain Analysis
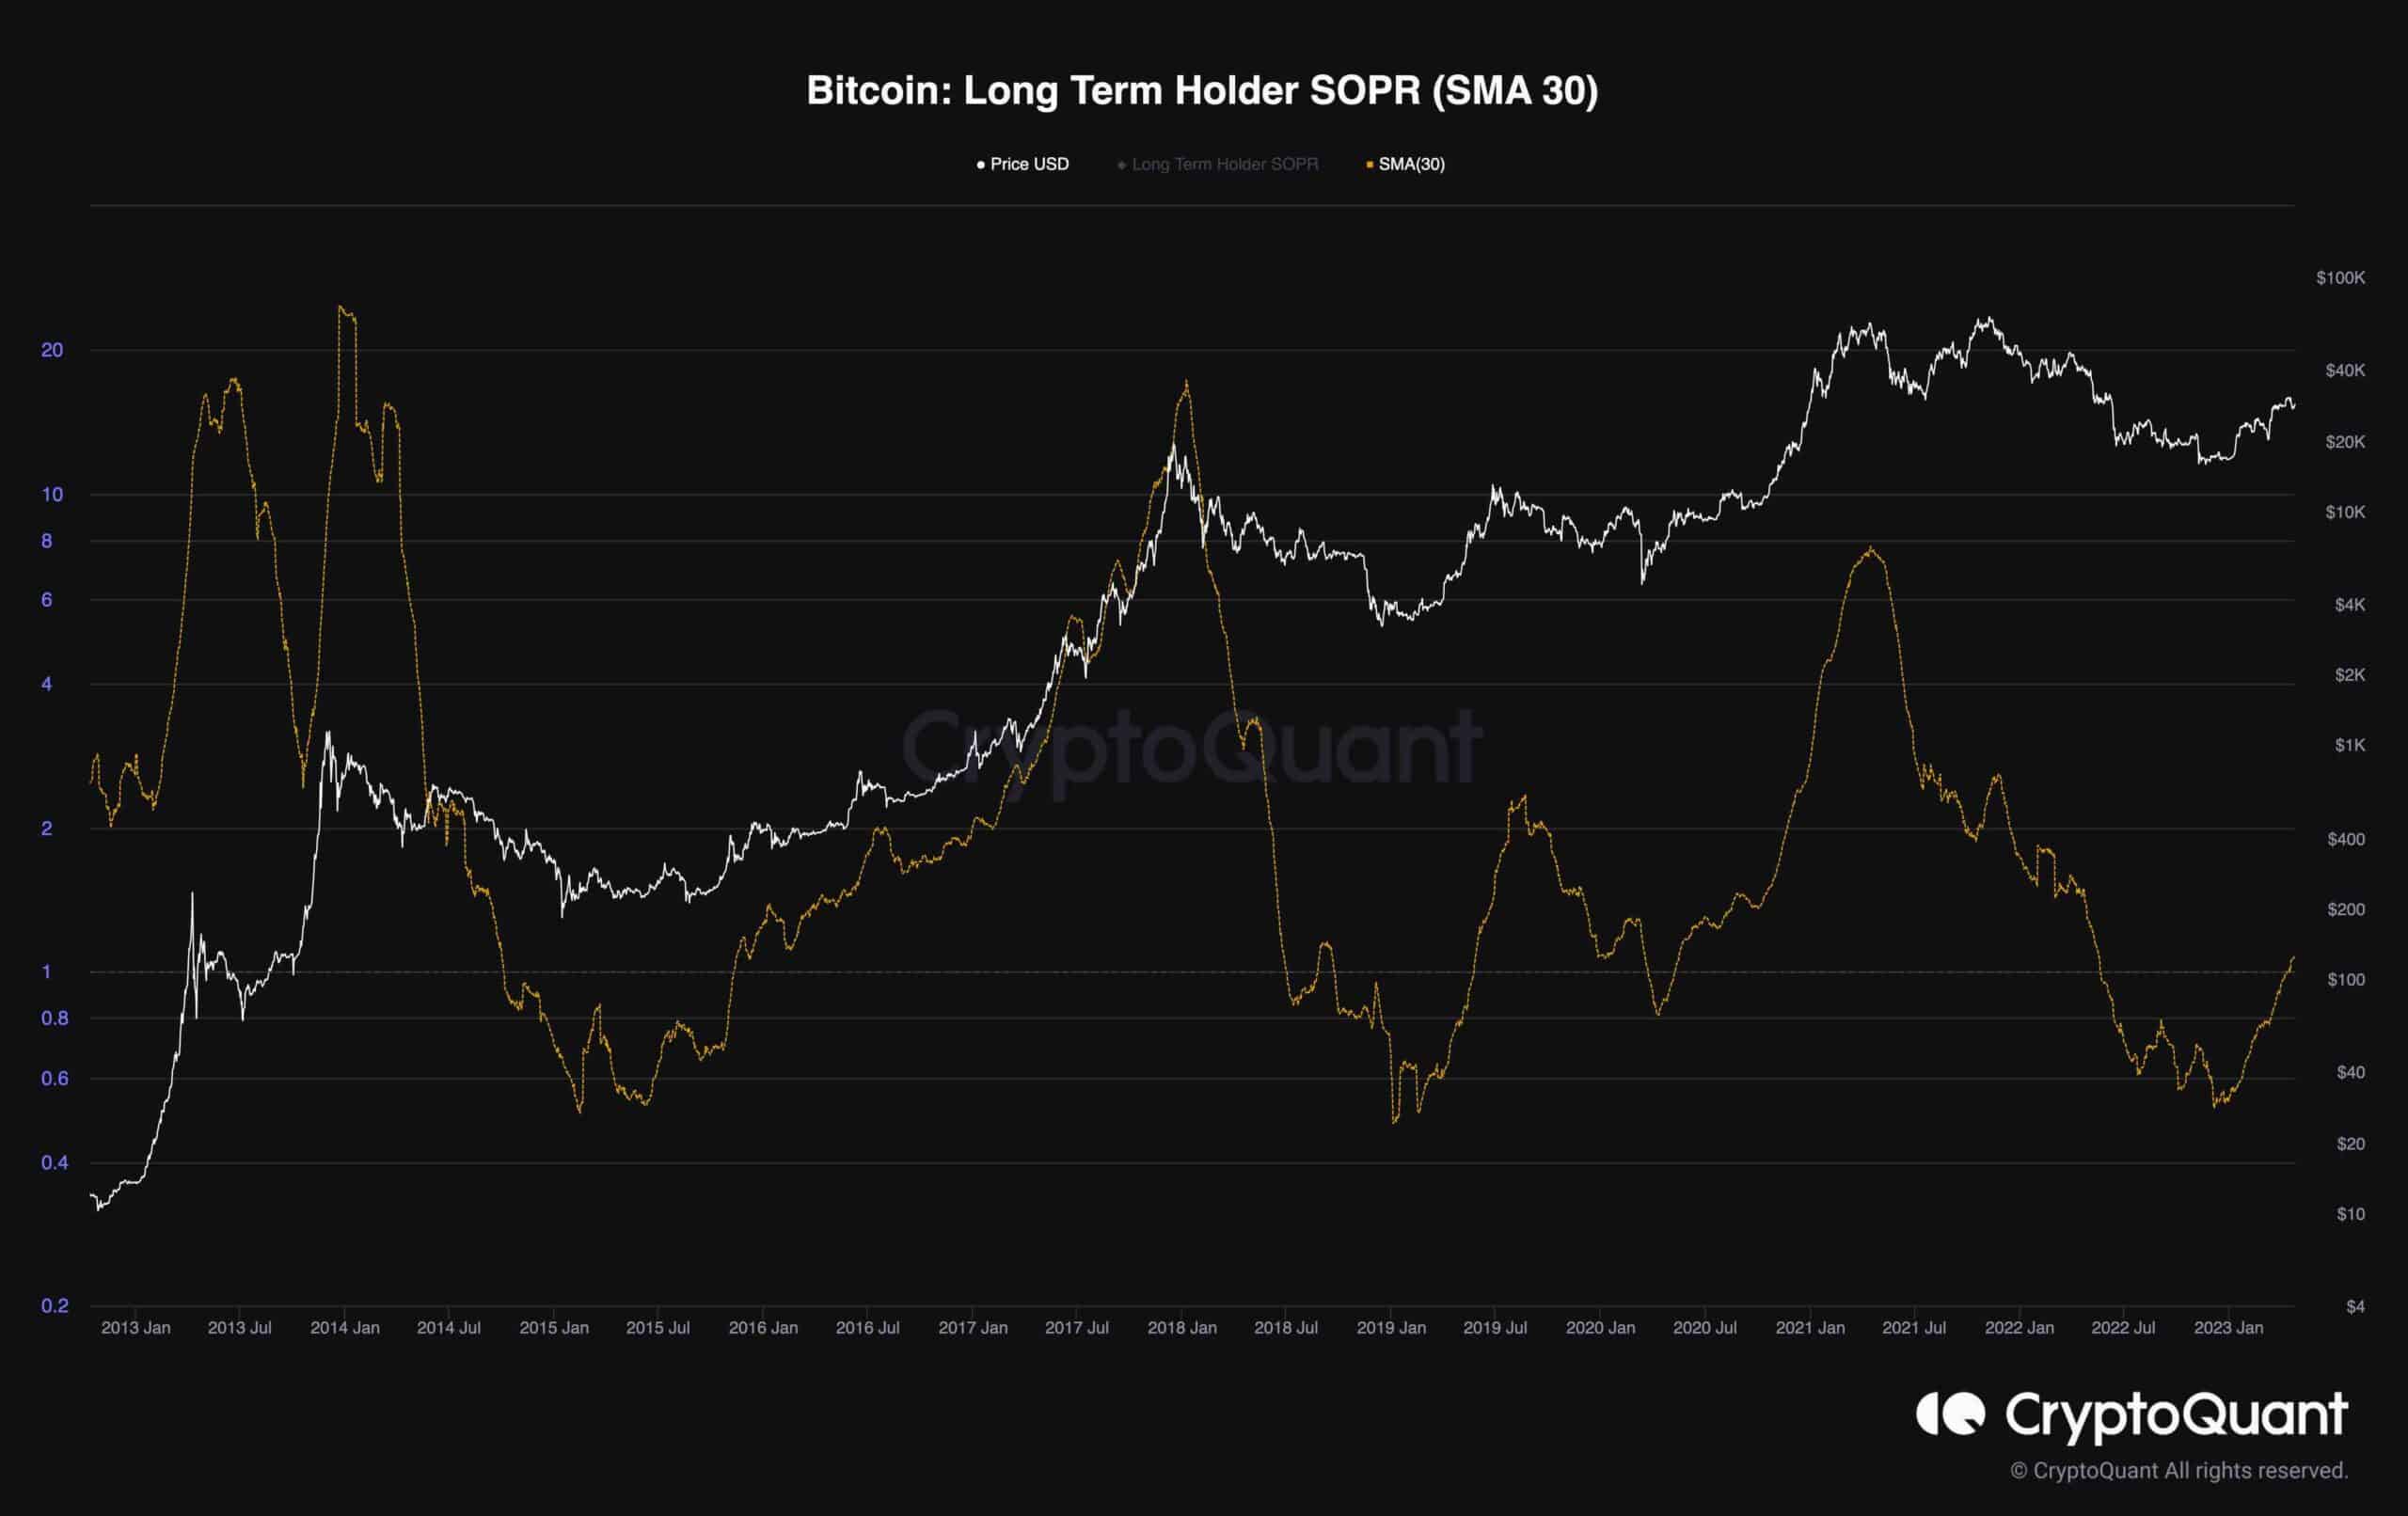
The spending of coins that have remained inactive for over 155 days typically suggests longer-term trends in Bitcoin, as was the case in the current scenario. By analyzing the Long-Term Holder Spent Output Profit Ratio (SOPR) using monthly averages, we can spot extreme spending points that align with the bear markets’ bottom.
In all past instances in Bitcoin’s history where the SOPR had similarly negative values, the price never dropped below that specific point. As such, this indicator suggests that the Bitcoin price will not go lower than the value established in November-December 2021.
It’s essential to note that this indicator mainly reflects long-term cycles, which usually take years to reach extremes, and it does not capture short-term fluctuations. Therefore, while long-term investors can benefit from strategic investments, traders should consider other indicators during transitional phases.