Bears are more powerful than bulls today as the rates of coins keep falling.
BTC/USD
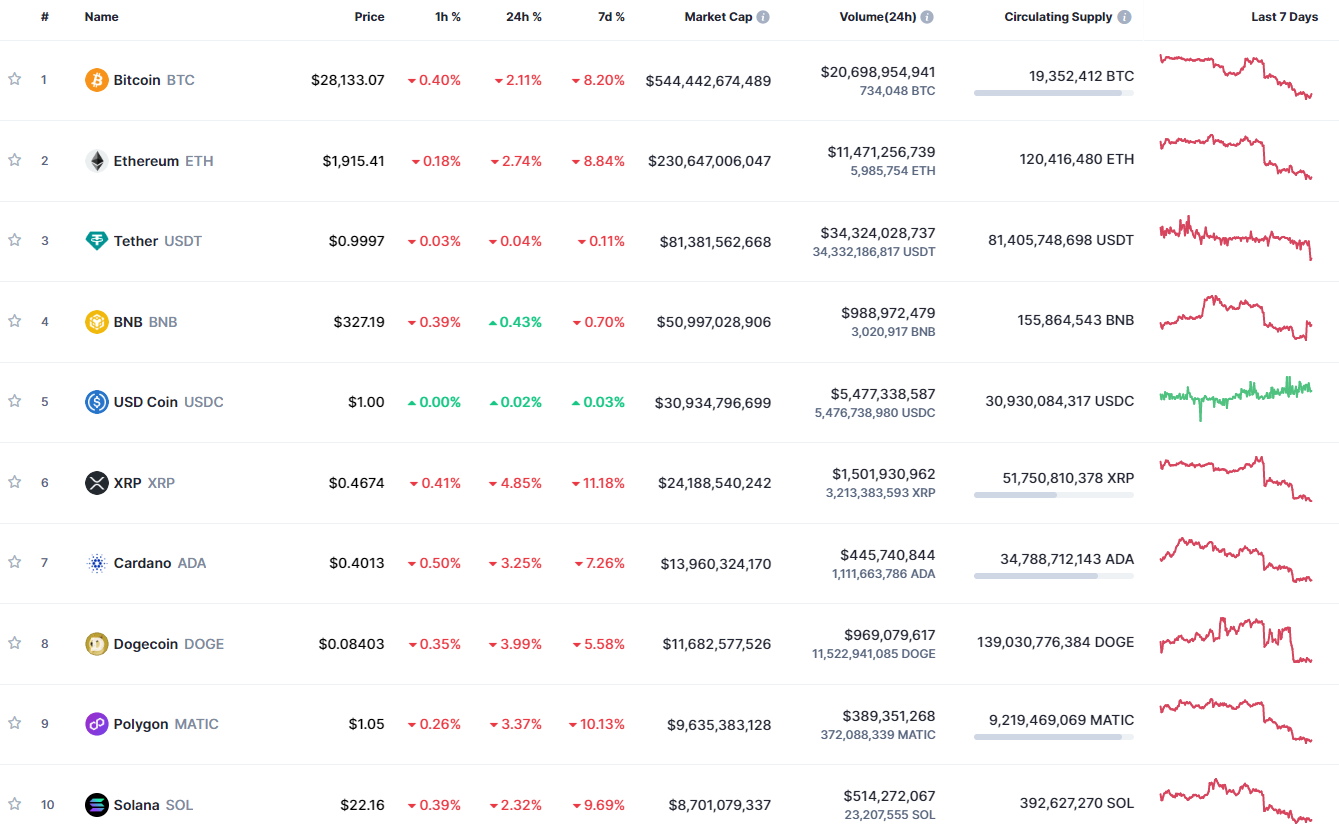
The rate of Bitcoin (BTC) has declined by 2.11% over the last 24 hours.
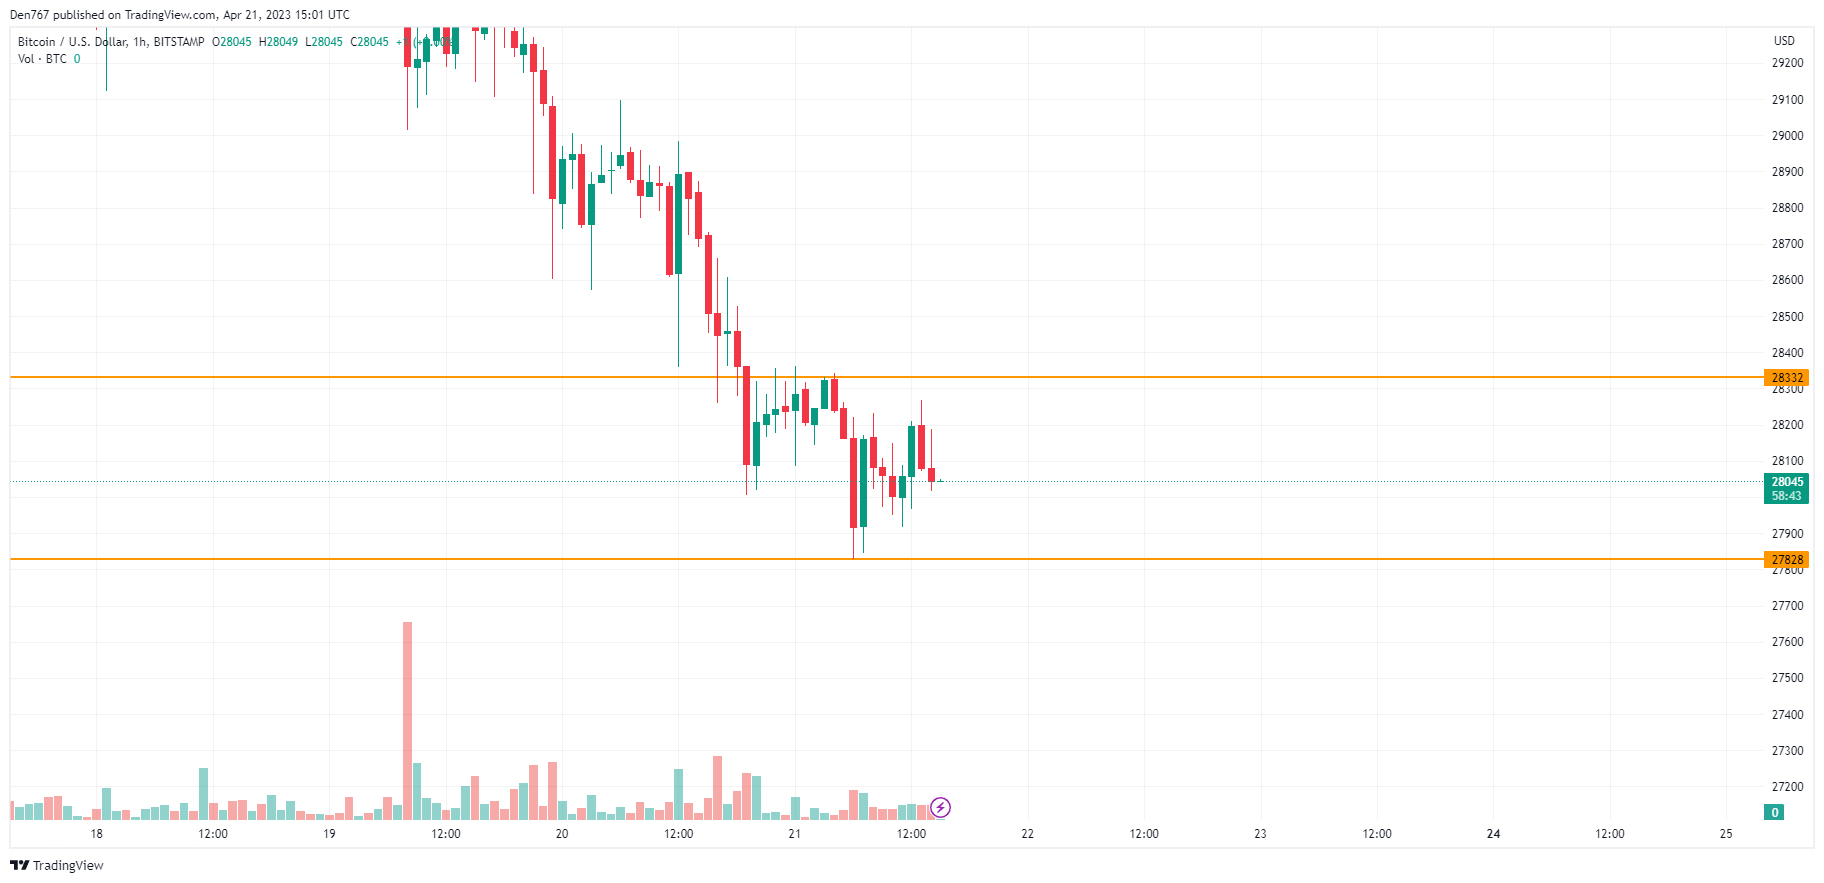
The rate of Bitcoin (BTC) is trading in the middle of the local channel, between the support at $27,828 and the resistance at $28,332. There are low chances of seeing any sharp moves by the end of day, as the coin has passed most of its ATR.
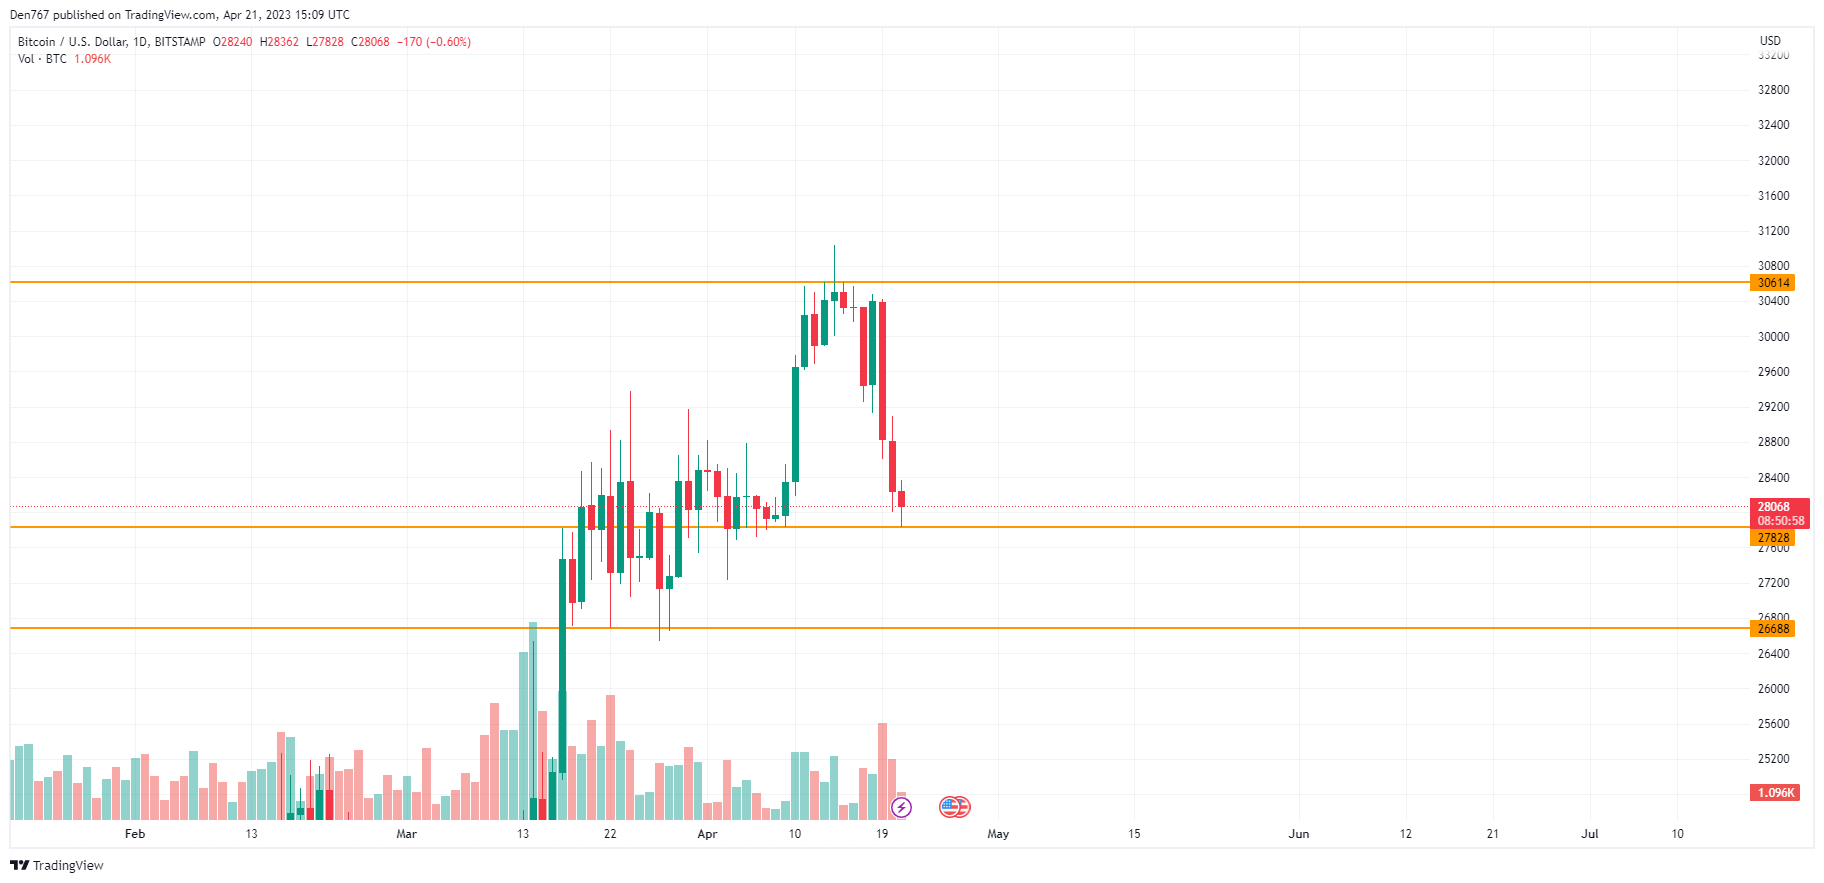
On the daily chart, the rate of Bitcoin (BTC) has bounced off the support level at $27,828. At the moment, traders should pay attention to the bar closure.
If sellers' pressure continues, the energy may be enough for the breakout, followed by a blast to the $27,000-$27,500 area.
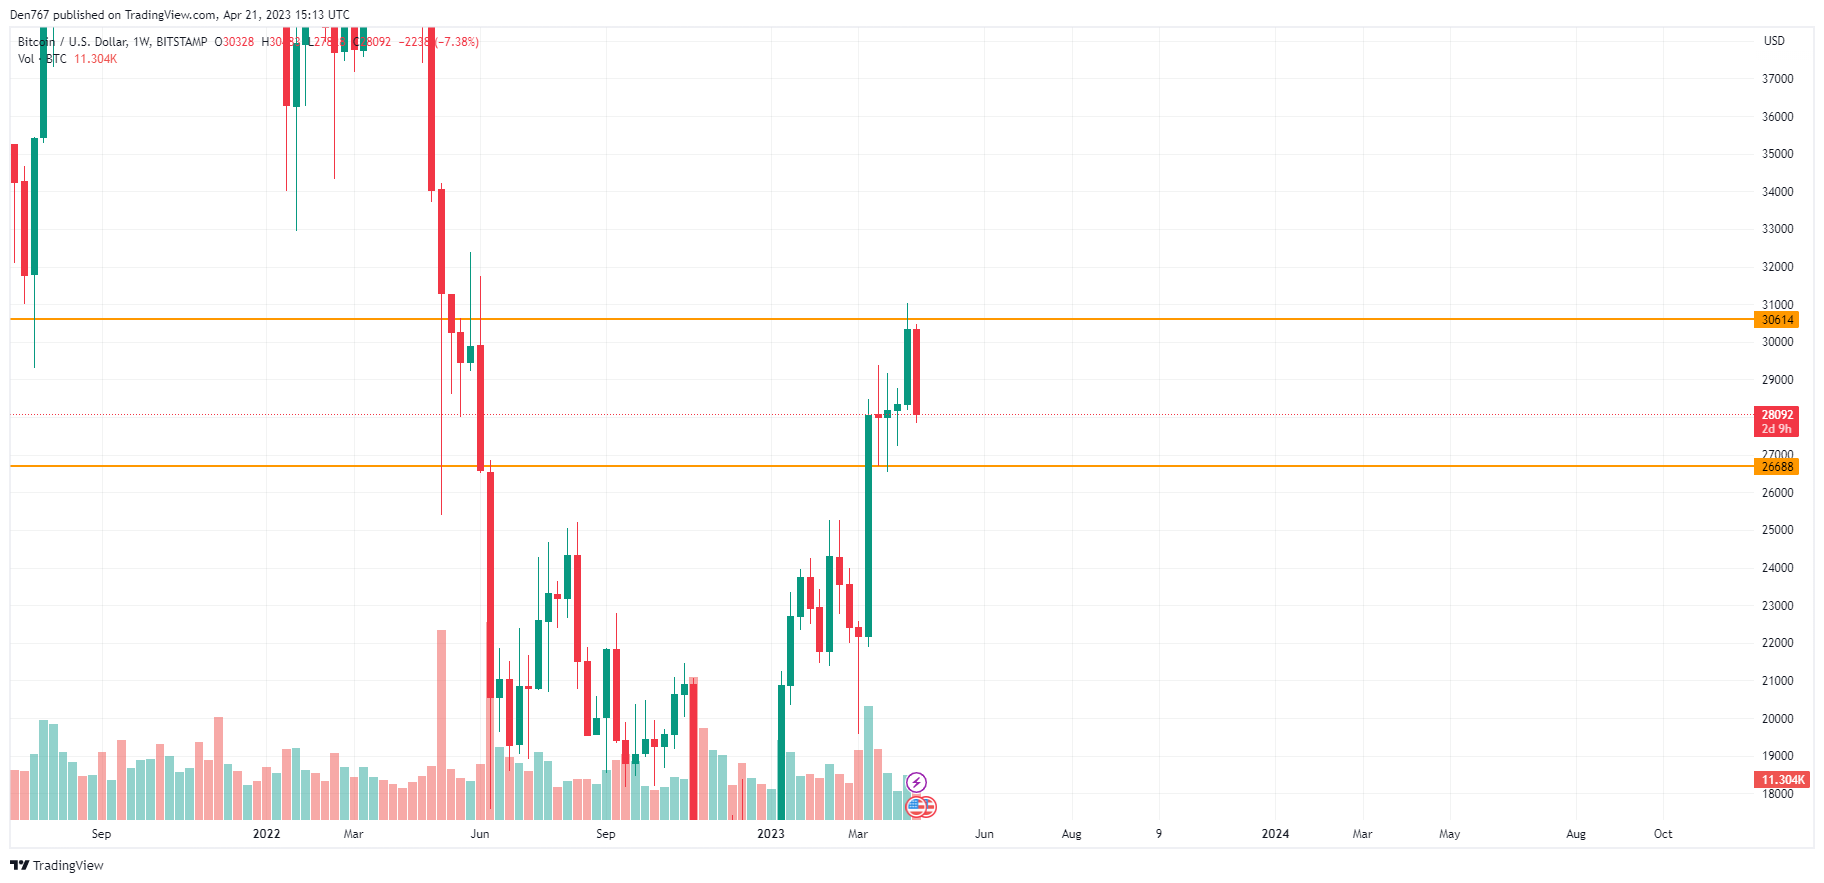
On the weekly chart, one should pay attention to the candle closure. If the bar closes below yesterday's low at $28,184, the decline may continue to the support level at $26,688. Such a scenario is relevant until mid-May.
Bitcoin is trading at $28,075 at press time.