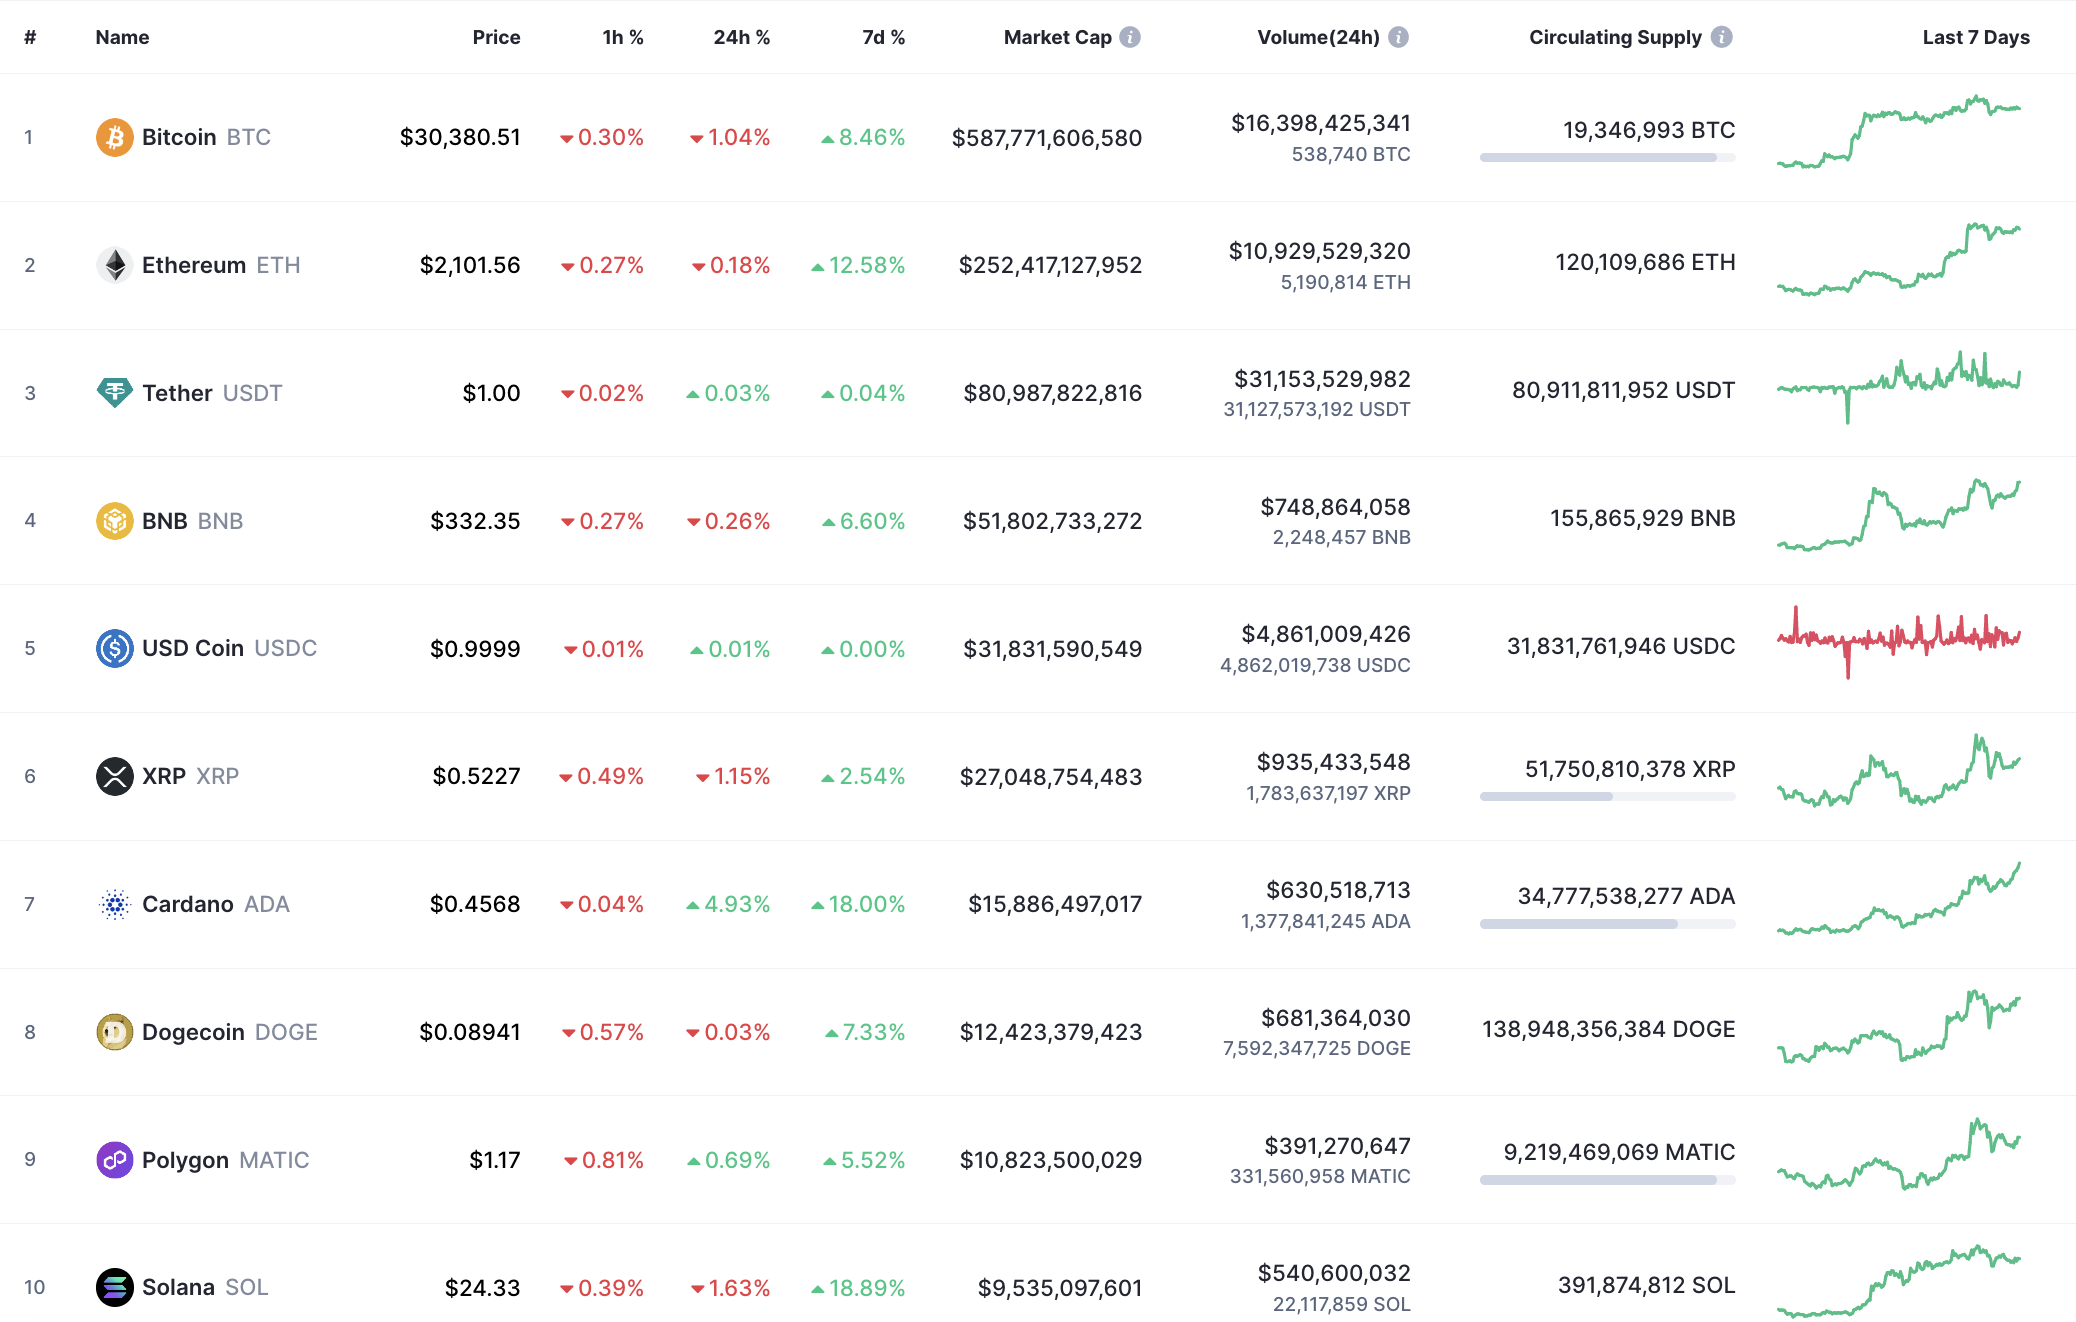
The market has faced a slight correction as some coins have returned to the red zone.
BTC/USD
The rate of Bitcoin (BTC) has declined by 1% over the last 24 hours.
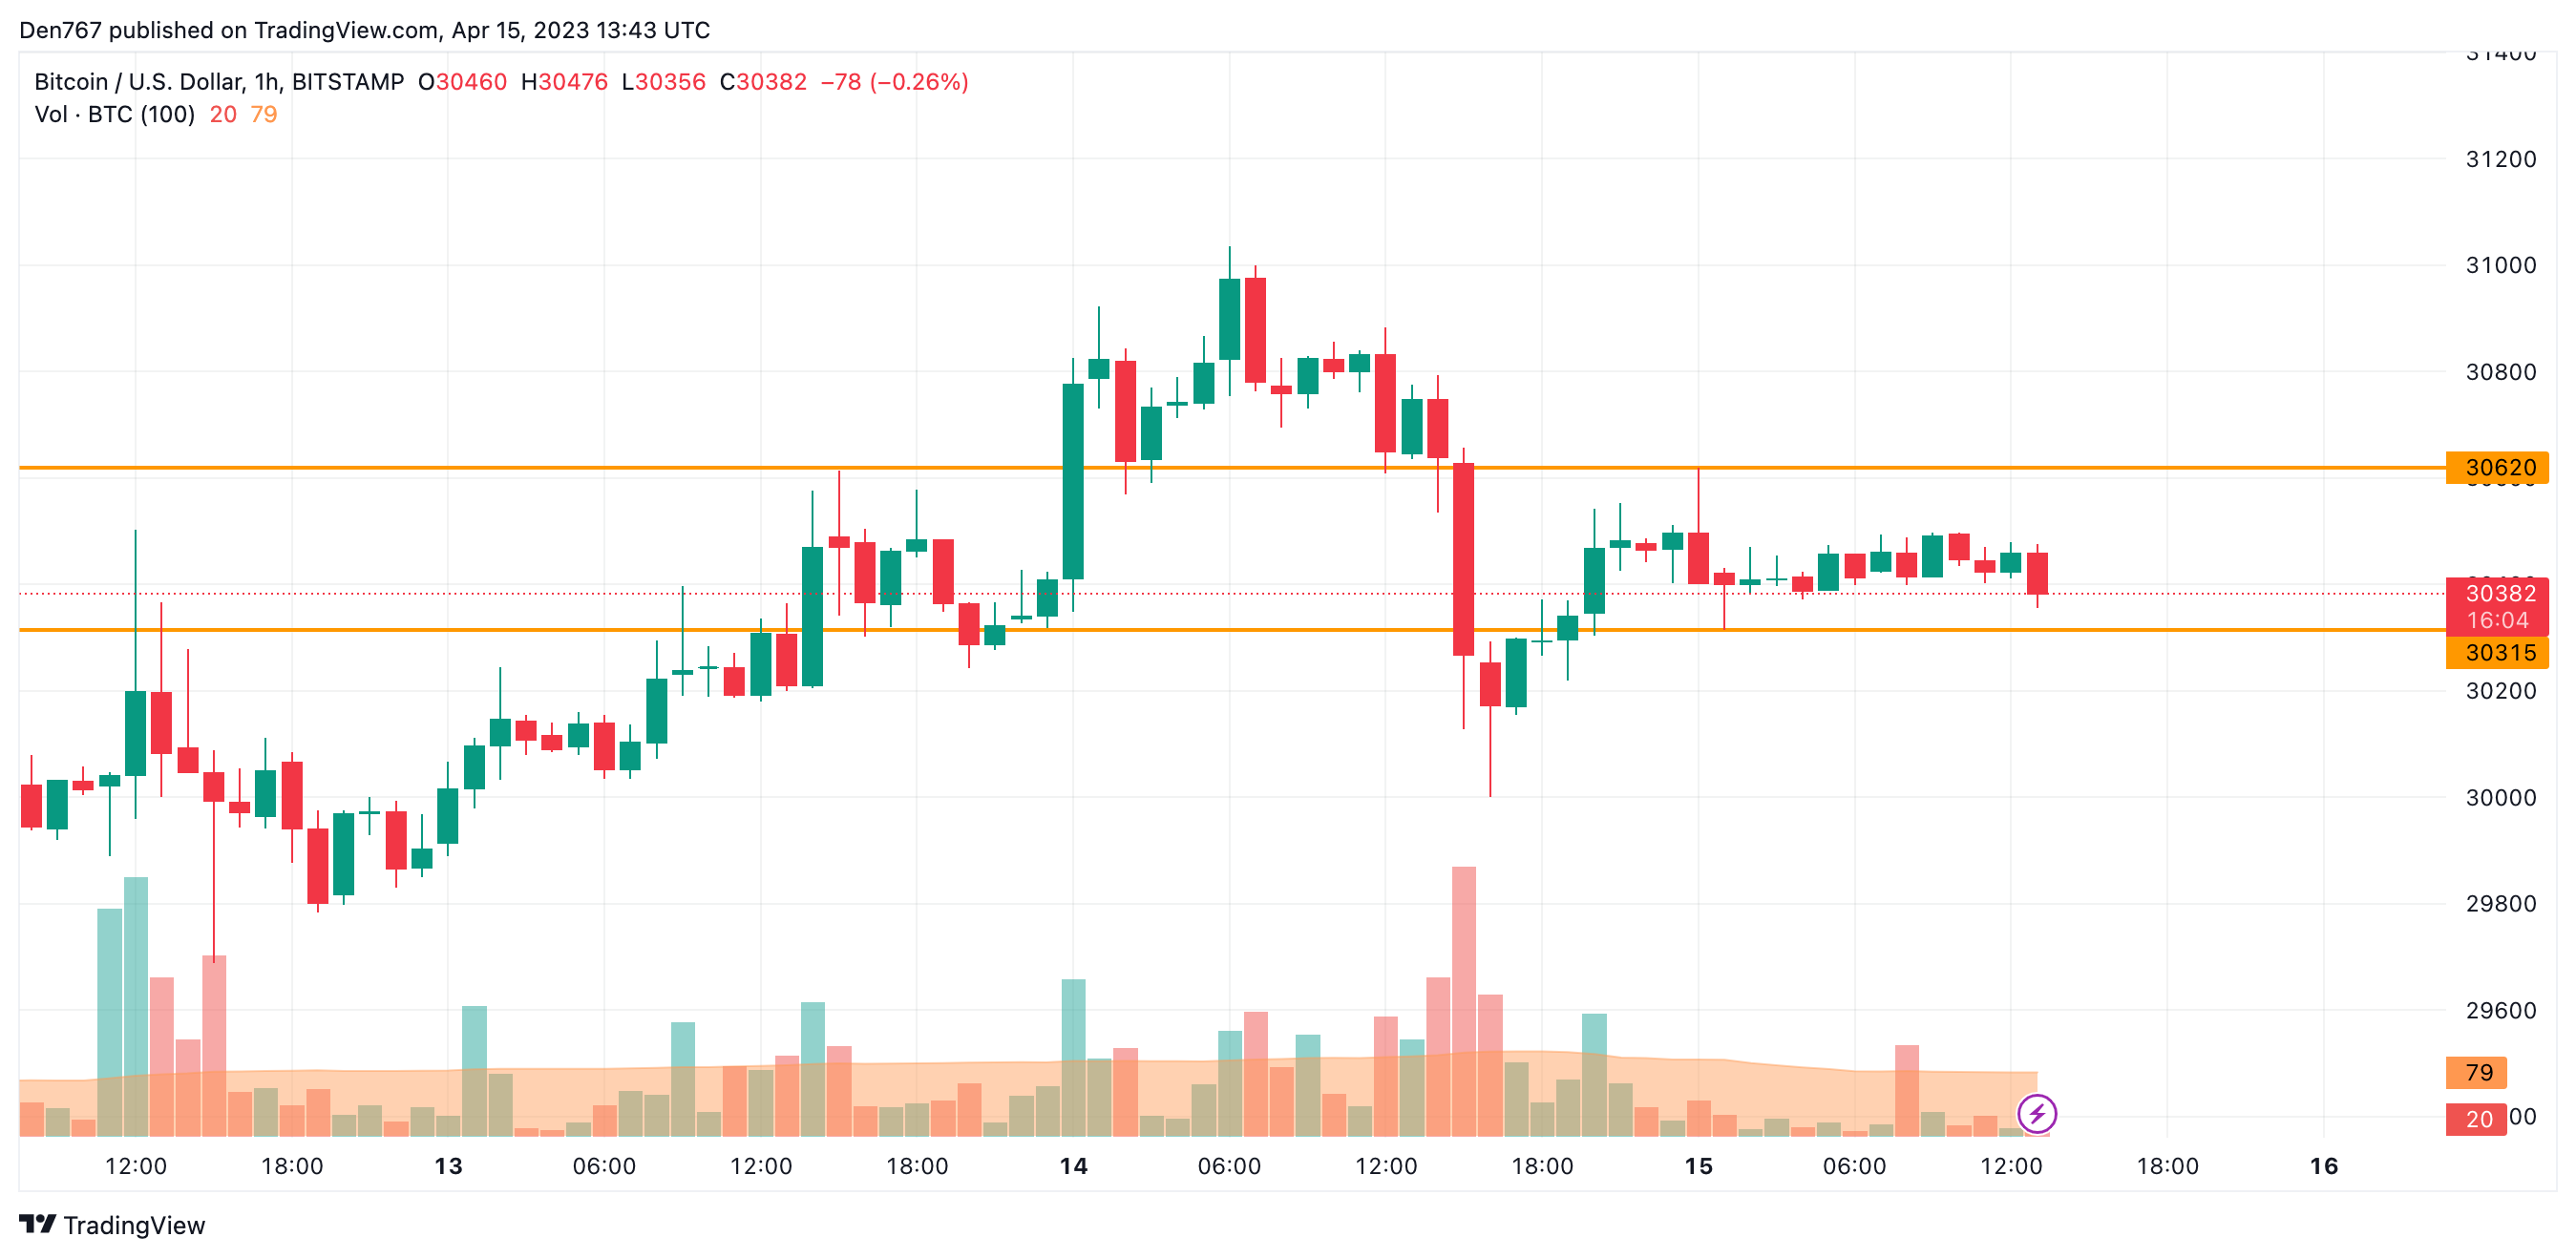
On the hourly chart, the rate of Bitcoin (BTC) is on the way to the local support at $30,315. If buyers cannot seize the initiative, the breakout can be a prerequisite for a sharp drop to the $30,100-$30,200 zone.
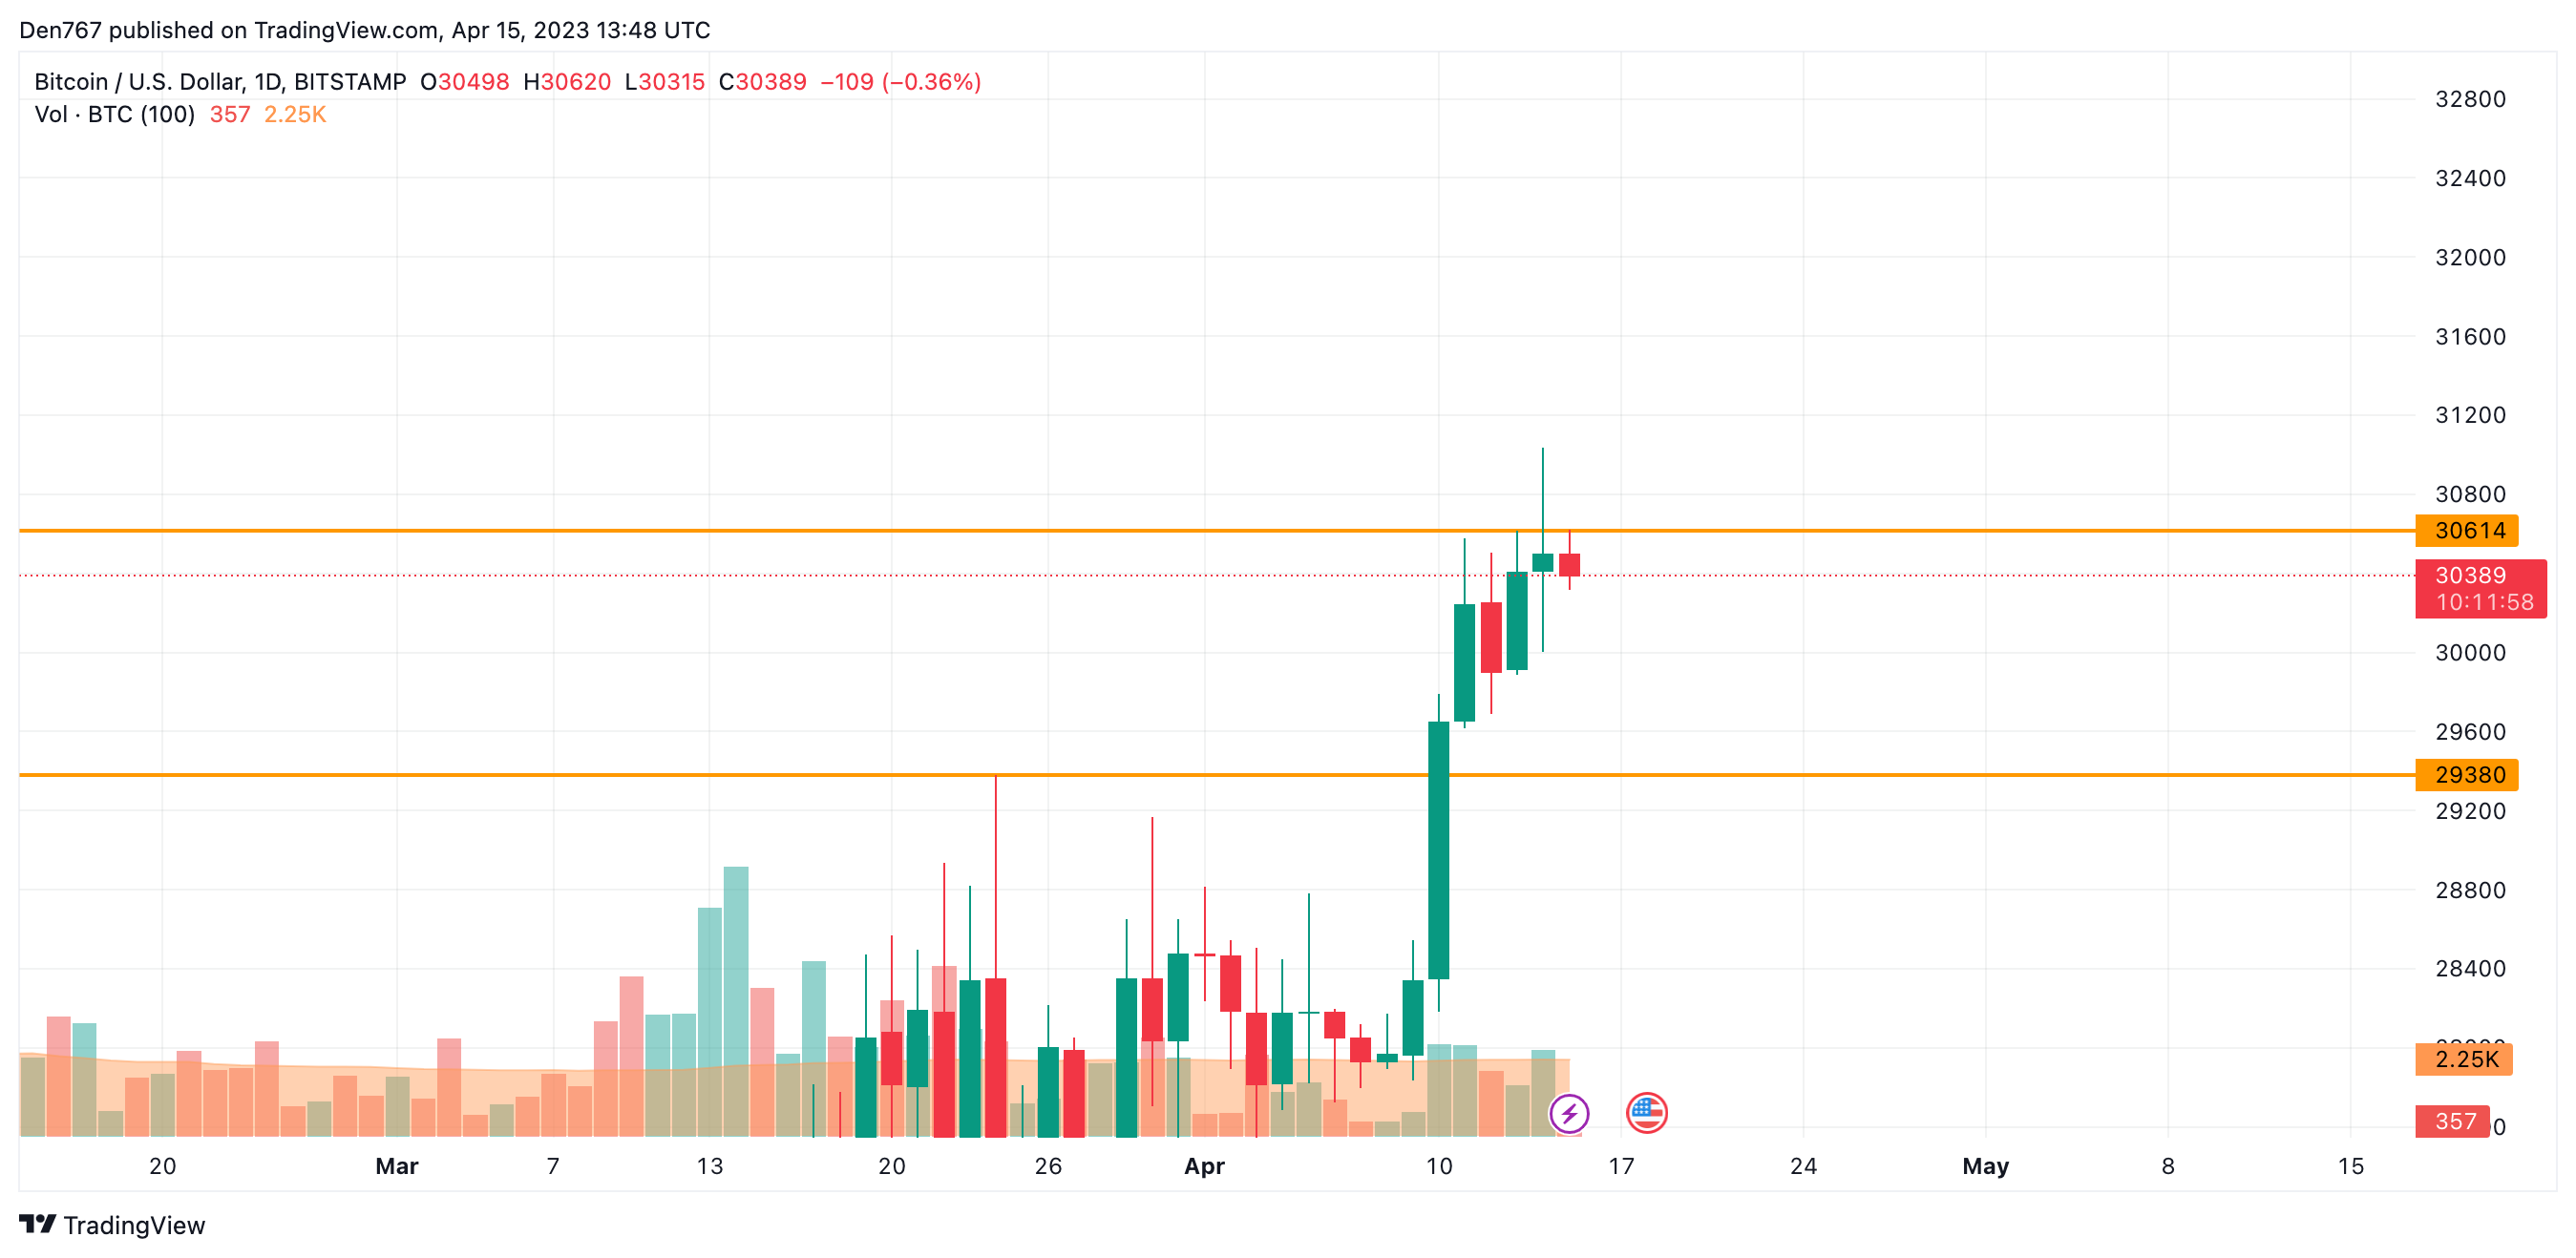
On the daily time frame, the rate of Bitcoin (BTC) has once again tested the resistance at $30,614. At the moment, neither buyers nor sellers are controlling the situation.
While the rate is above the vital $30,000 mark, there is nothing to worry about. However, if a breakout of it happens, the drop may continue to the support at $29,380.
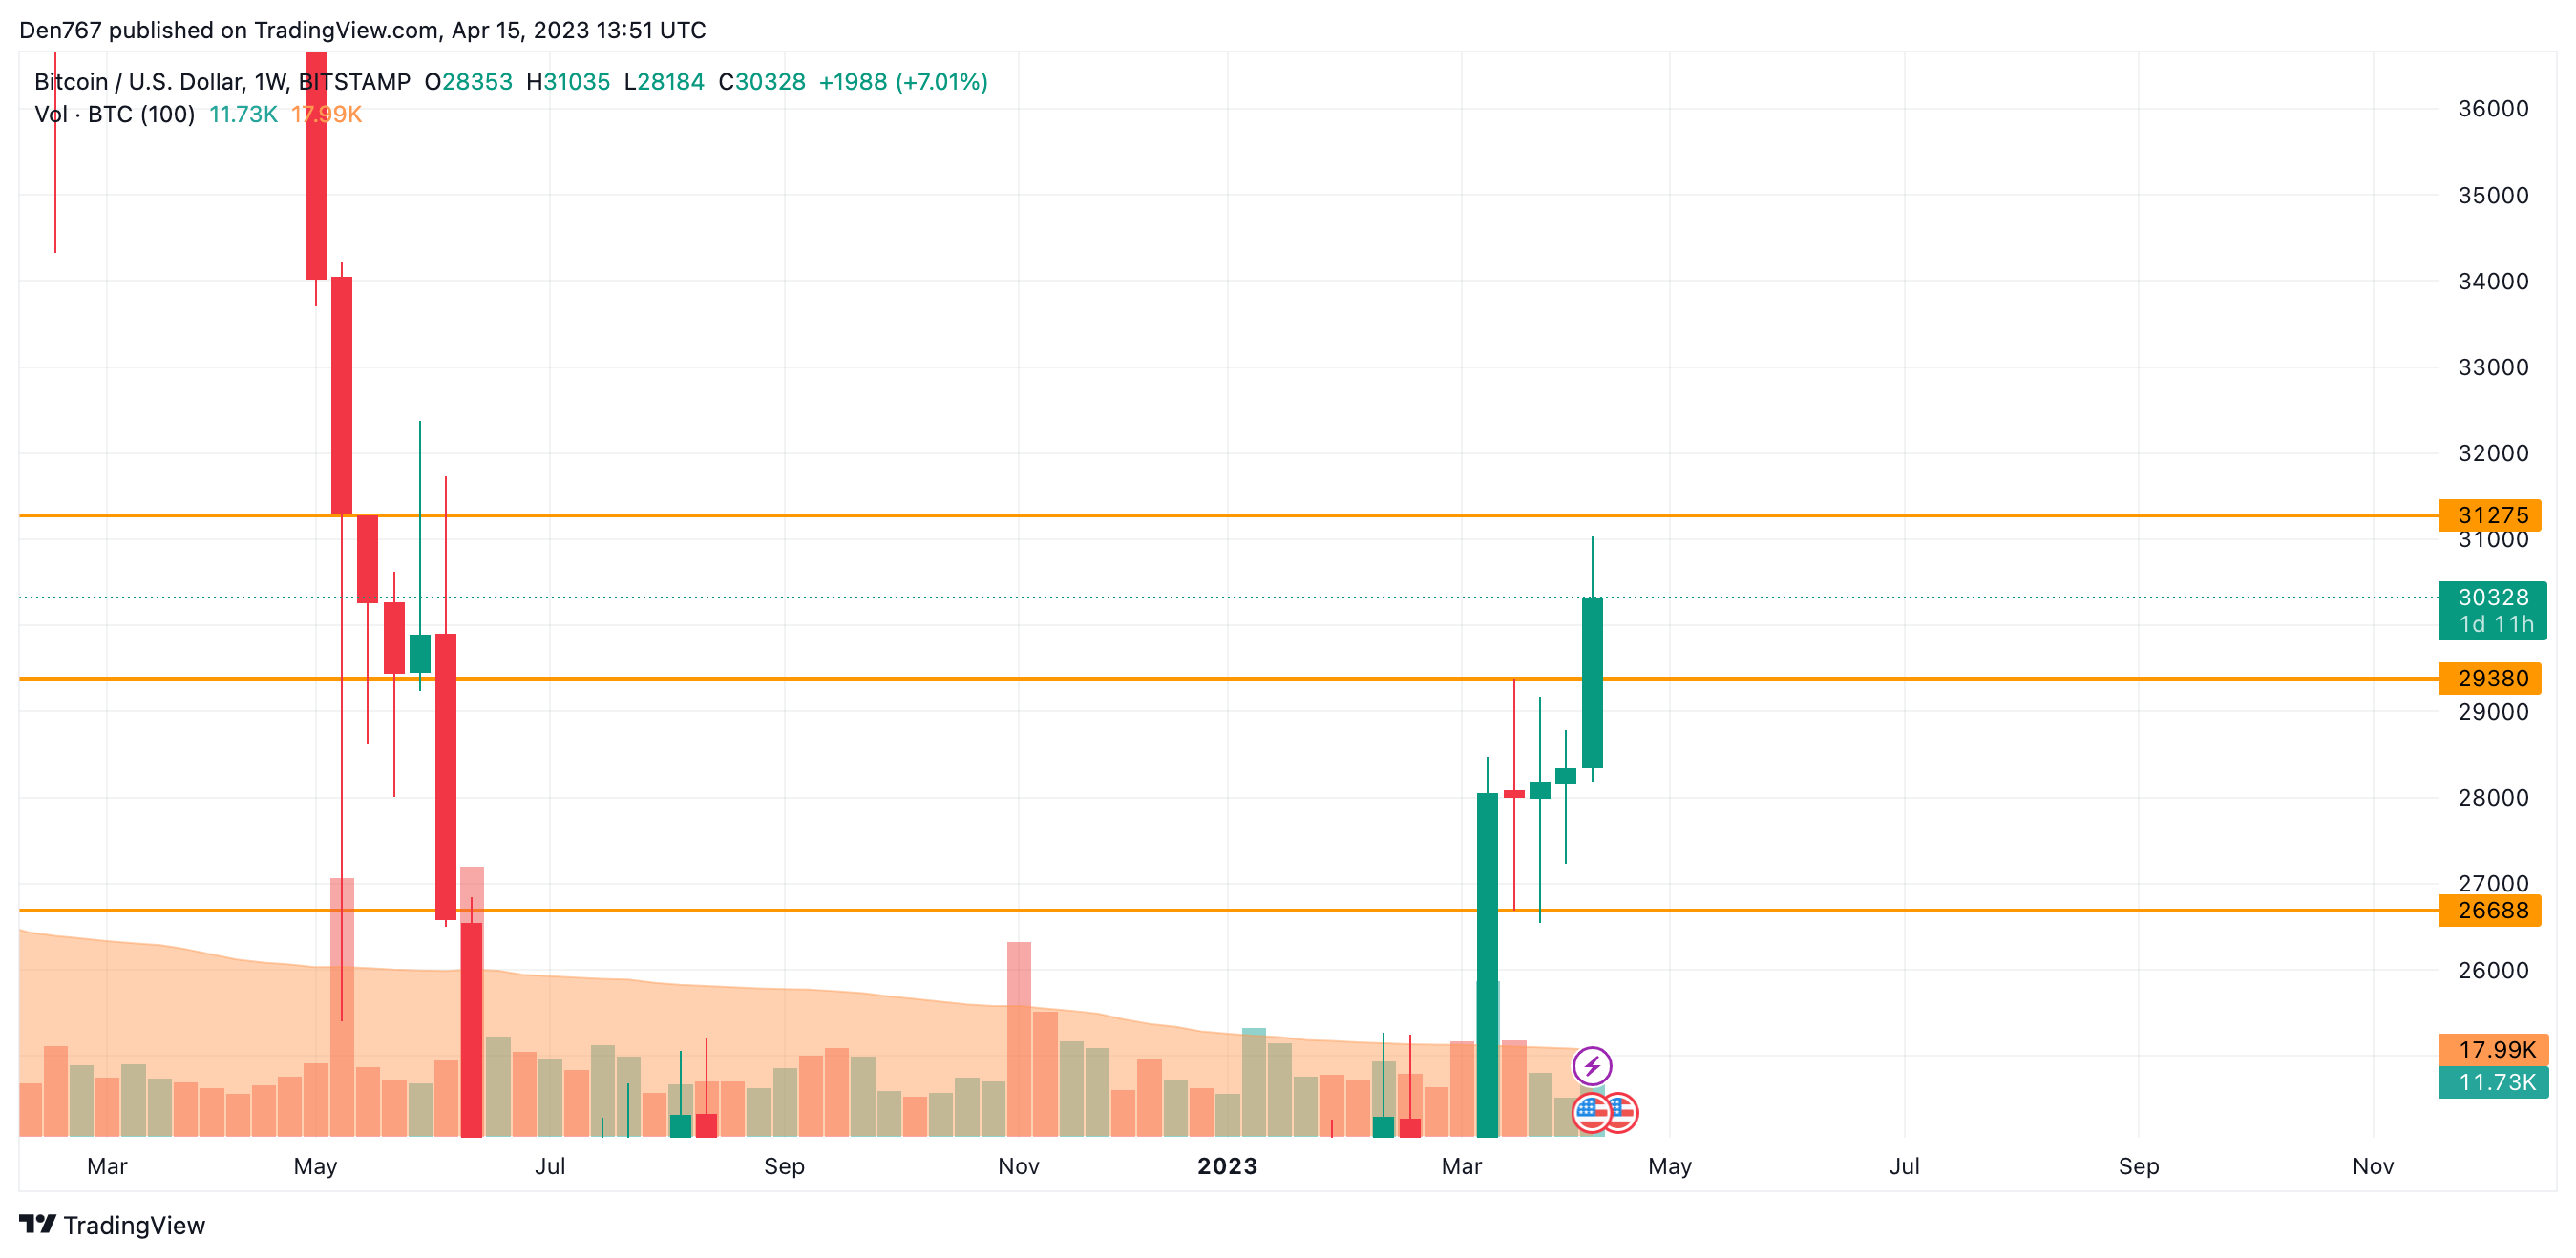
From the midterm point of view, the rate of Bitcoin (BTC) has fixed above the resistance at $29,380. However, bulls might need more time to accumulate energy for a further move. In this case, sideways trading in the area of $29,500-$30,500 is the more likely scenario for the next days.
Bitcoin is trading at $30,368 at press time.