Bitcoin price is consolidating gains above the $30,000 zone. BTC is showing a few signs of a downside correction below the $30,000 level.
- Bitcoin attempted a fresh increase and spiked above the $30,450 resistance zone.
- The price is trading above $30,000 and the 100 hourly Simple moving average.
- There is a key rising channel forming with support near $30,000 on the hourly chart of the BTC/USD pair (data feed from Kraken).
- The pair could start a downside correction if there is a close below the $30,000 support.
Bitcoin Price Struggles
Bitcoin price remained strong above the $30,000 pivot level. BTC attempted another increase above the $30,200 and $30,250 levels. However, the bears were active near the $30,500 resistance zone.
A high was formed near $30,577 and the price started a consolidation phase. There are clear signs of trend exhaustion above the $30,000 level. It is still trading well above $30,000 and the 100 hourly Simple moving average.
Besides, there is a key rising channel forming with support near $30,000 on the hourly chart of the BTC/USD pair. The channel support is near the 23.6% Fib retracement level of the upward move from the $28,200 swing low to the $30,577 high.
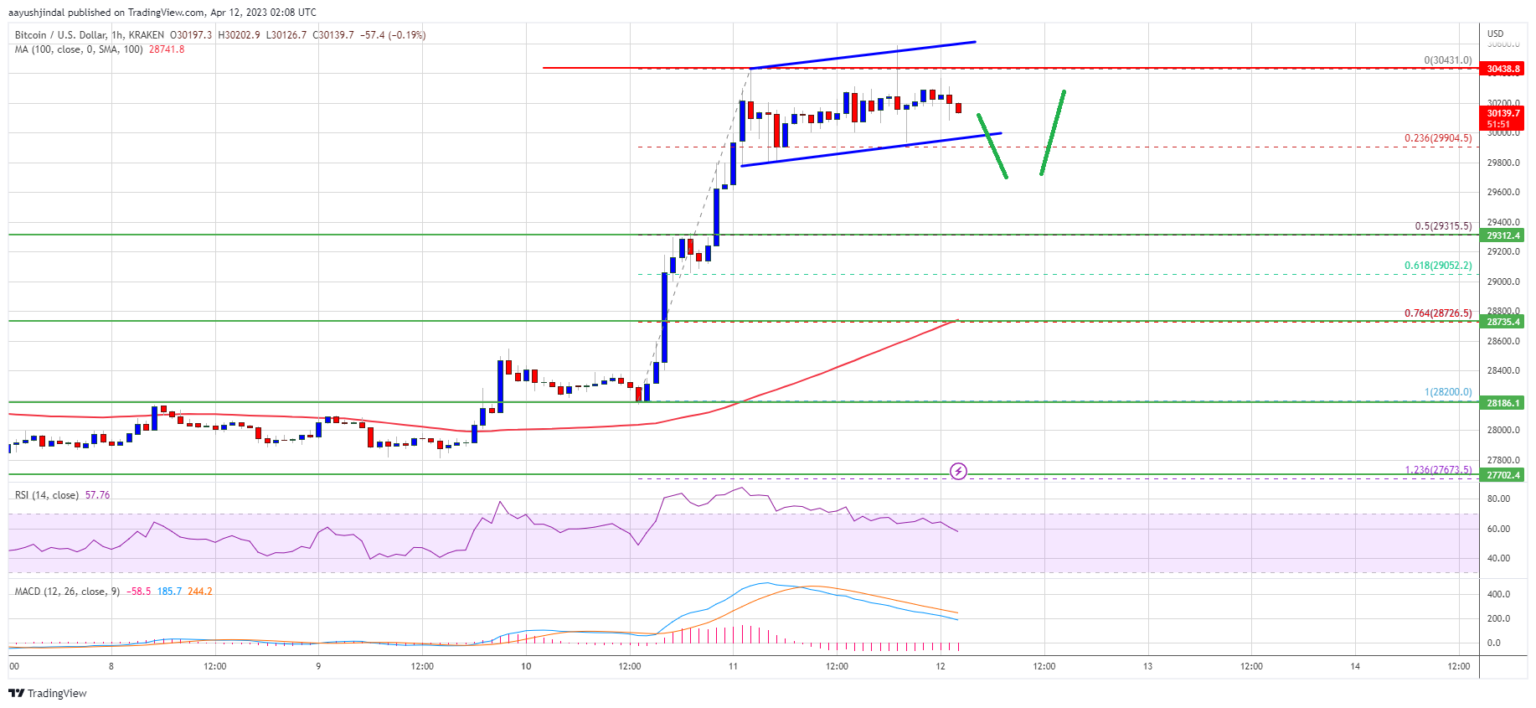
Source: BTCUSD on TradingView.com
Immediate resistance is near the $30,250 level. The next major resistance is near the $30,500 zone. A close above the $30,500 resistance might start a fresh increase. In the stated case, the price may perhaps rise toward the $31,200 level. The next key resistance is near the $32,000 level, above which the bulls might aim for a move toward the $33,500 level.
Downside Break in BTC?
If Bitcoin’s price fails to clear the $30,500 resistance, it could start a downside correction. Immediate support on the downside is near the $30,000 level.
The next major support is near the $29,400 zone and the 50% Fib retracement level of the upward move from the $28,200 swing low to the $30,577 high. A downside break and close below the $29,400 support might push the price back toward $28,800 or the 100 hourly Simple moving average. Any more losses might call for a drop toward the $28,200 support zone.
Technical indicators:
Hourly MACD – The MACD is now losing pace in the bullish zone.
Hourly RSI (Relative Strength Index) – The RSI for BTC/USD is now near the 50 level.
Major Support Levels – $30,000, followed by $29,400.
Major Resistance Levels – $30,250, $30,500, and $31,200.