After weeks of going nowhere, Bitcoin price is gearing up for a massive move. Buckle up, because we are going to show you why, according to the Bollinger Bands, BTC is about to blow.
Crypto Market Goes Calm After A Q1 2023 Comeback
Bitcoin has managed to survive a brutal crypto winter and even show resilience throughout bleak macro conditions and rising interest rates from the US Federal Reserve. Bitcoin’s price fell sharply throughout 2022, but since the start of 2023, it has made a strong recovery.
Despite the recently positive outlook for Bitcoin price, it has been stuck in a tight range for several weeks now. The top cryptocurrency by market cap has been trading between $27,000 and $29,000 unable to break out of this range. Many traders and investors are eagerly anticipation more confirmation of new trend to emerge, but the market appears to need a catalyst before a significant breakout or breakdown.
The lack of volatility and sideways movement has caused the Bollinger Bands on the daily timeframe to become the tightest they have been since January 2023. The Bands were even more narrow then, and resulted in a 40% rise. Tightening Bollinger Bands signal that volatility is incoming for Bitcoin, and traders and investors should be prepared for a rollercoaster ride.
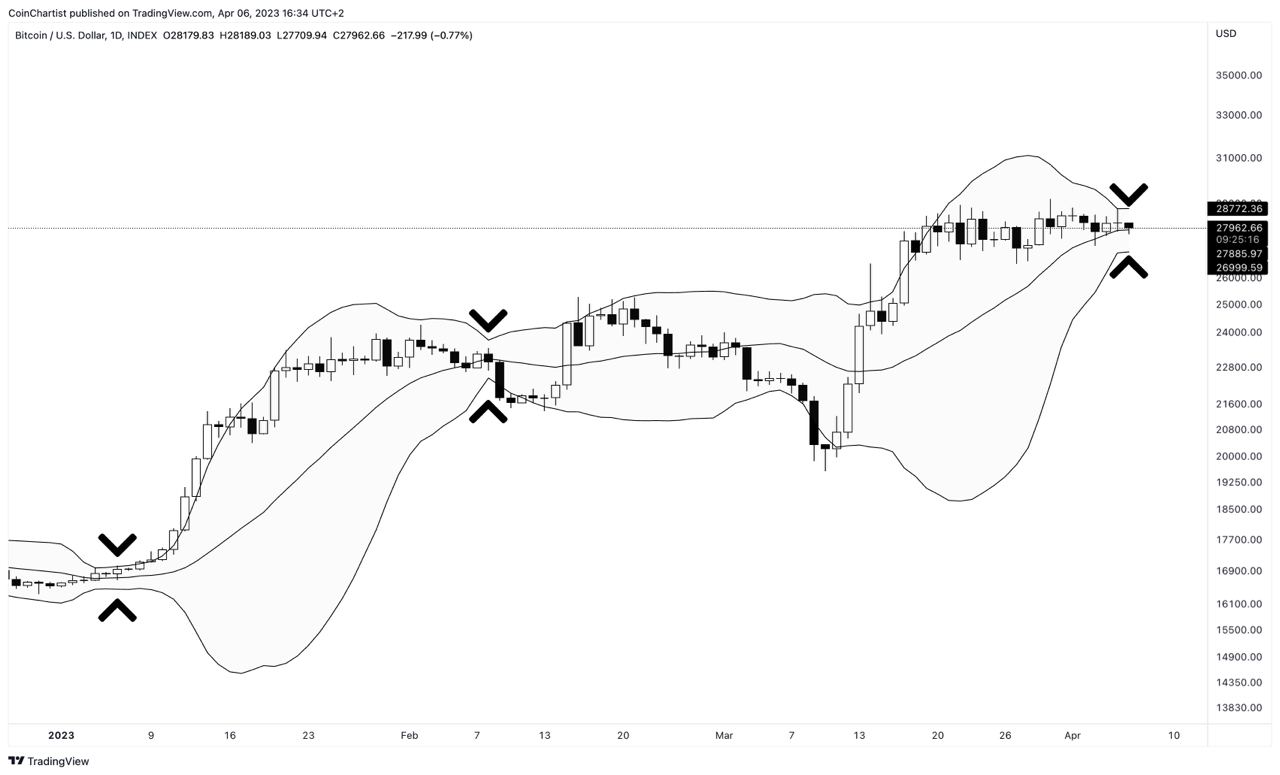
The bands are tight and ready to explode | BTCUSD on TradingView.com
Bollinger Bands Suggest Powerful Volatility In Bitcoin Is Ahead
The Bollinger Bands are a technical analysis tool that was created by John Bollinger in the early 1980s. The tool is used to measure the volatility of an asset by using moving averages and standard deviations. The bands consist of three lines: a middle line that represents the 20-period simple moving average, and two outer lines that are two standard deviations away from the SMA.
When the Bollinger Bands are tight, it means that the asset’s price is trading in a narrow range, and volatility is likely to follow. On the other hand, when the bands are wide, it indicates that the asset’s price is experiencing significant volatility. A squeeze occurs when a period of narrowing gives way to sudden, violent expansion.
Given the current tightness of the Bollinger Bands for Bitcoin, the squeeze setup suggests a that a significant price move is imminent. The direction of this move is uncertain, however. Regardless, traders and investors should be prepared for volatility in the coming days or weeks.
With a big move on the way, what can we expect if the direction is ultimately bearish or bullish? A bullish breakout should take BTCUSD well above $30,000 per coin, possibly extending to $40,000 in several weeks if the trend persists. A bearish breakout, meanwhile would have Bitcoin retesting $20,000 or possibly lower.
Are you ready for the volatility? pic.twitter.com/YDnVZ272rQ
— Tony "The Bull" (@tonythebullBTC) April 6, 2023
Follow @TonyTheBullBTC & @coinchartist_io on Twitter or join the TonyTradesBTC Telegram for exclusive daily market insights and technical analysis education. Please note: Content is educational and should not be considered investment advice. Featured image from iStockPhoto, Charts from TradingView.com