The latest Bitcoin price analysis shows a mixed reaction from both buyers and sellers. Buyers are seen pushing the price higher in an attempt to take back control of the asset while sellers are trying to keep a lid on its gains. At the time of writing the BTC/USD pair is trading near $27,914 and is moving in an uptrend. The bearish movement that was in place for the past few hours took the BTC below $28,000. However, the buyers defended the $27,765 support level and pushed the price back up to $27,914
The current bullish impulse in the BTC market could bring a surge of buying pressure with it. As such, it is likely that bulls will try to break through the resistance barrier at $28,178. If successful, this could lead to a fresh leg up in the BTC market and possibly put the asset on track for a new all-time high. On the other hand, if buyers fail to break through the resistance level at $28,178 then there is a chance of retracement back down toward the support levels.
Bitcoin price analysis 24-hour price chart: Bullish trend uplifts coin value up to $27,914 high
The 24-hour Bitcoin price analysis is confirming an upturn in price as the bulls have been able to find their way to recovery. The BTC/USD value has been revived once again as the coin is trading at $27,914 at the time of writing, gaining 0.45 percent value during the last few hours. The bears had been leading the market in the previous hours, but now the bullish momentum is resurging as the crypto pair is reporting an increase in value.
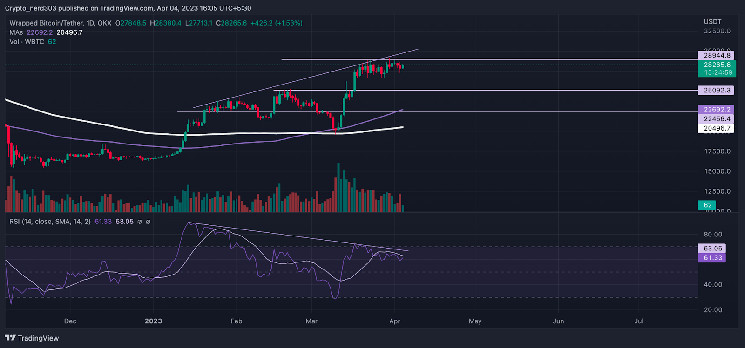
The market capitalization of the asset stands at $539 billion as of now. The 24-hour trading volume is reported to be around $12 billion with a market circulating supply of 19 million BTC coins. The technical indicator in the daily chart is showing a mixed reaction from both bears and bulls. The MACD chart is currently indicating a bullish crossover as the signal line is about to cross above the MACD line. On the other hand, the RSI is in a neutral zone, hovering around the 50 mark at 58.85. The Bollinger bands on the daily chart are also slowly widening, indicating an increase in volatility. The upper Bollinger Bands is at $28,796 and the lower band is at $27,328.
Bitcoin price analysis: Recent developments and further technical indications
The four hours Bitcoin price analysis confirms that a bullish trend has been following for the last few hours with bearish also trying to make gains. The selling pressure and buying pressure are in equilibrium resulting in a mixed movement, the next market for BTC will be crucial in determining whether the bulls will have the upper hand or not.
The hourly technical indicators are still in mixed positions as the MACD chart shows a bullish crossover, with green and red bars alternating above the signal line. The RSI is also in a neutral zone, hovering around the 40 mark at 45.05, and if bullish or bearish pressure increases, the RSI might move to the overbought or oversold region. The Bollinger bands are slowly widening, signifying an increase in volatility while the upper band is at $28,621 and the lower band is at $27,827.
Bitcoin price analysis conclusion
Based on the recent Bitcoin price analysis, it is clear that the bulls and bears are struggling to control the asset. Although the bulls have been able to push the price higher and recover from bearish movements, there is still a lot of uncertainty about whether they will be able to break through resistance levels. The current indicators show that market volatility is increasing which could lead to further gains or losses in the near future.
While waiting for Bitcoin to move further, see our Price Predictions on XDC, Polkadot, and Curve