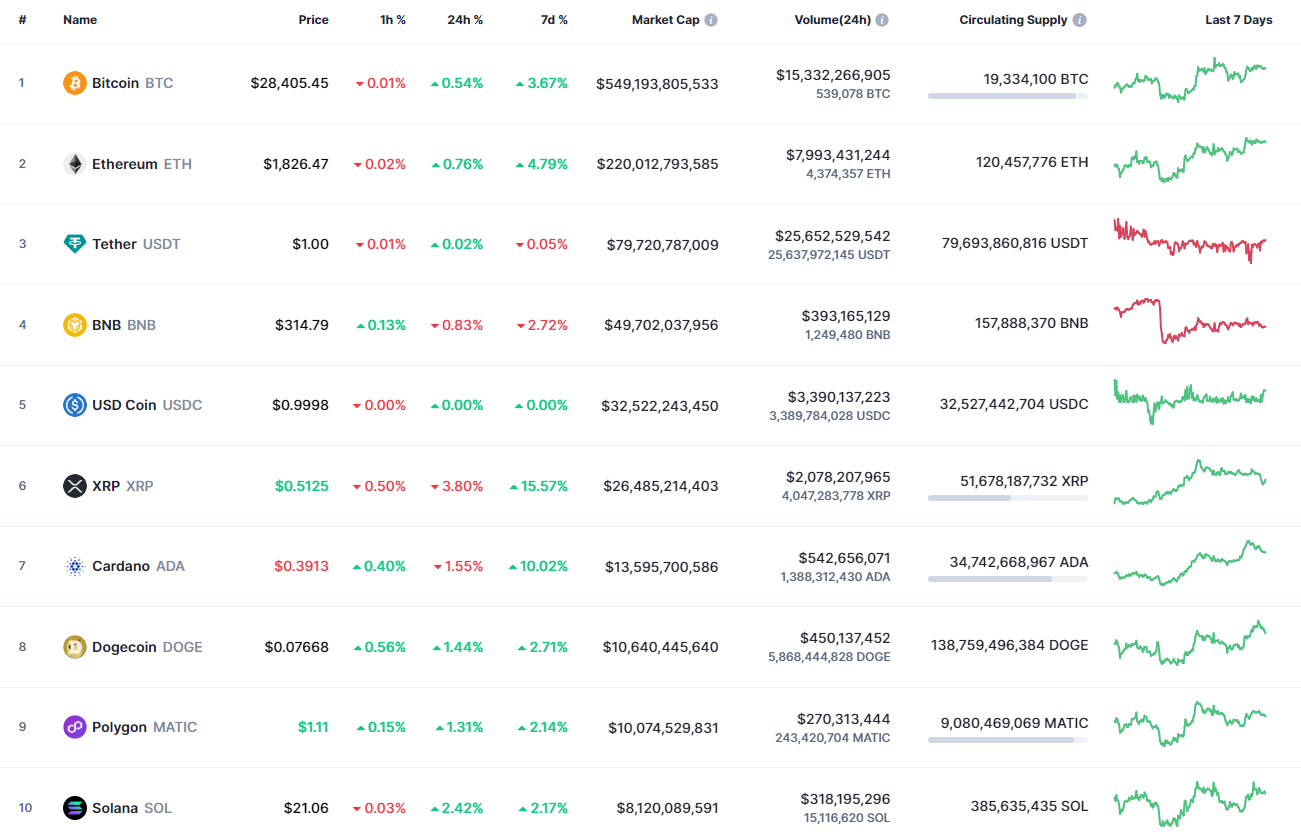
The weekend has started with ongoing bull dominance, however, there are some exceptions.
BTC/USD
The rate of Bitcoin (BTC) has risen by 0.54% over the last 24 hours.
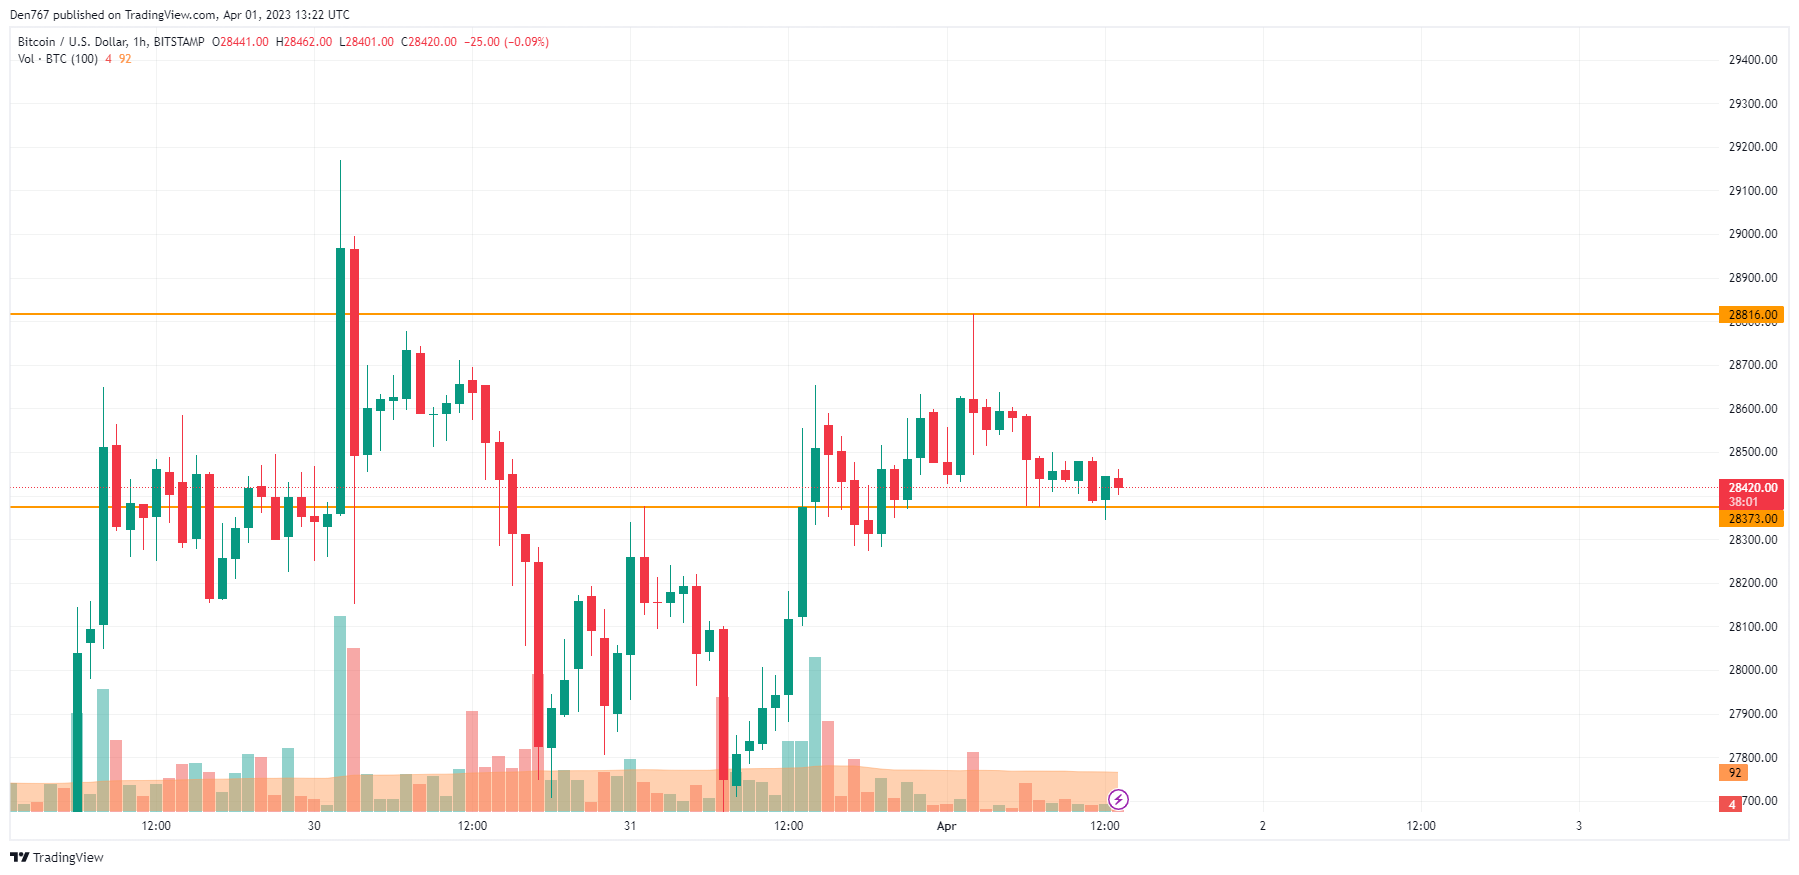
On the hourly chart, the rate of Bitcoin (BTC) is returning to the recently formed support level at $28,373. If the seller pressure continues, the breakout may lead to a sharp drop to the $28,000 zone.
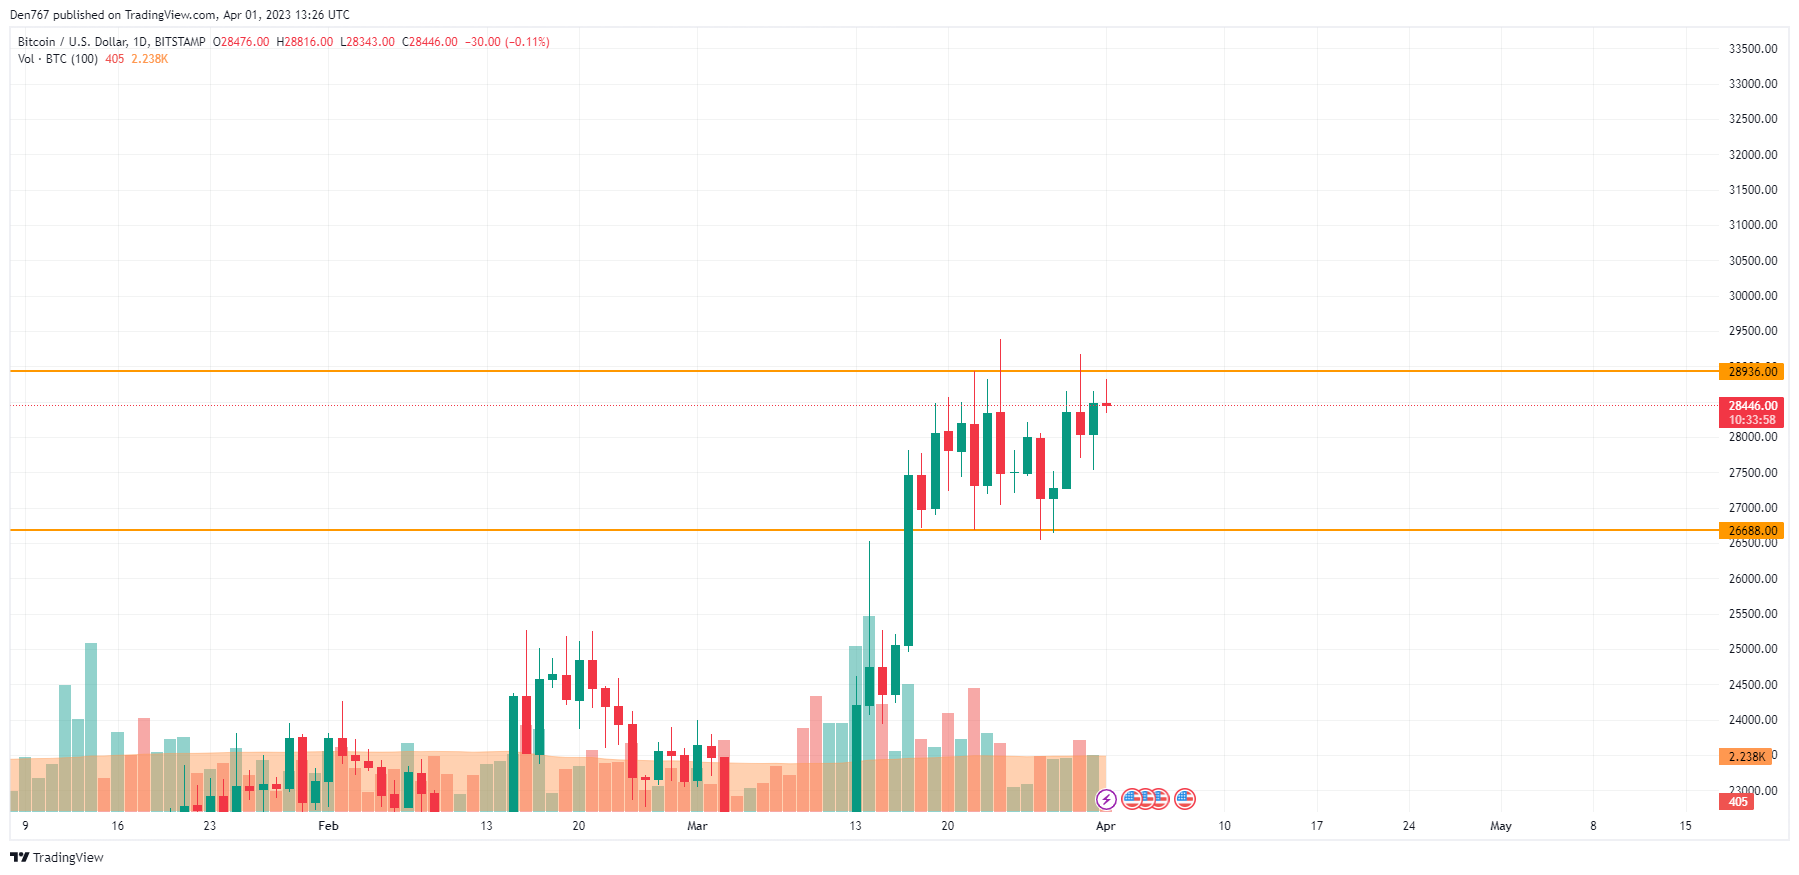
On the bigger time frame, the rate of Bitcoin (BTC) is unable to return to the resistance at $28,939. If the situation remains the same, there is a high chance to see a decline to the middle of the channel, to around the $27,500 area.
Such a scenario is relevant until the end of the upcoming week.
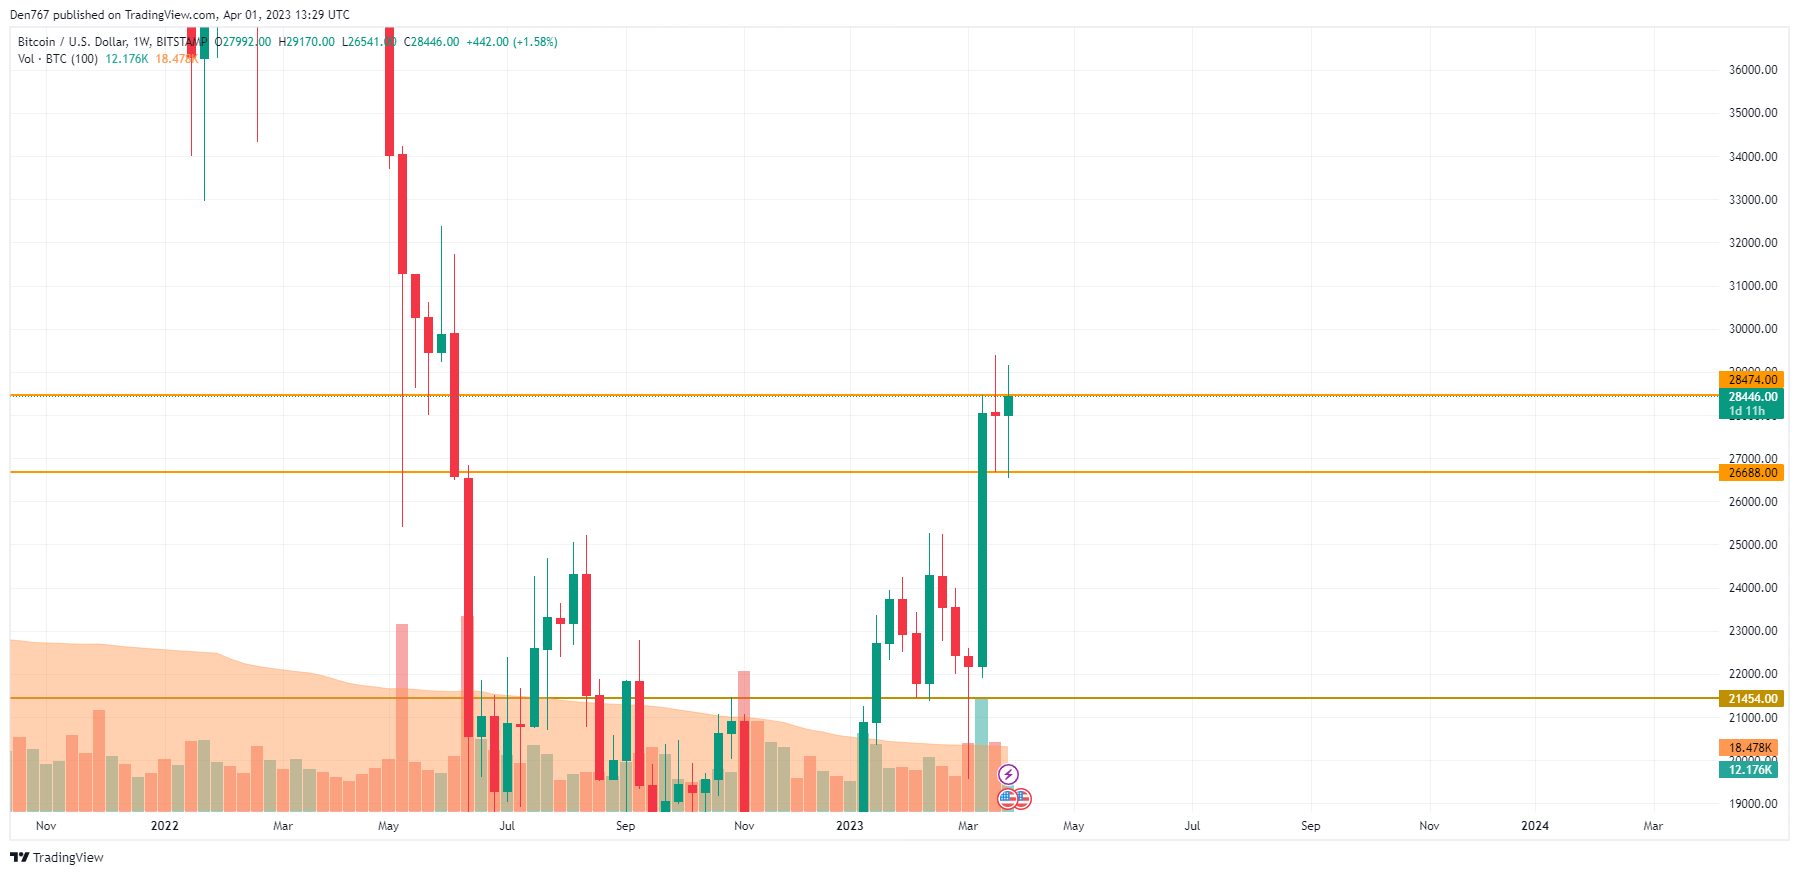
From the midterm point of view, the price of BTC is trying to fix above the resistance at $28,474. If the bar closes with no wicks and closer to the $29,000 mark, one can expect a test of the important area of $30,000 shortly.
Bitcoin is trading at $28,445 at press time.