Bitcoin price is trading around $25,000, following a meltdown across the banking sector. The first ever cryptocurrency designed to allow individuals to be their own bank, has given banks a run for their money amidst a series of bank runs and collapses across the United States and the globe.
Take a closer look at the crypto price charts you absolutely cannot miss.
Bitcoin Priced In Bank Shares Rockets To New All-Time High
Bitcoin was created in 2009 during the aftermath of the Great Financial Crisis by the still-unidentified Satoshi Nakamoto. Hidden within the Genesis block there is a message referencing the cover story on The Times about the second bailout for banks.
The message made Bitcoin’s mission clear: remove the need for third-parties from the financial system and free humanity from the impact of greed and the elite. Essentially, the decentralized cryptocurrency-based protocol allows anyone to be their own bank, custody their own assets, and send and receive money without an intermediary like a bank.
Over the last week, several banks nearly collapsed resulting in yet more bailouts some 14 years after the launch of the first ever cryptocurrency. The story rarely changes, with governments and central banks quick to swoop in and stop a crises from further developing.
Like dominoes, several banks revealed major issues, ranging from Silicon Valley Bank, Silvergate, Signature Bank, and Credit Suisse. While the factors behind each instance varies, the end result was the same: customers realized they cannot trust the banks with their deposits. Signature Bank’s story is a little bit more complex, and was potentially shuddered due to involvement with crypto.
Since the ordeal began, Bitcoin has been on a tear priced in USD and other global currencies. BTC priced against bank shares? Well, that’s a crypto price chart you simply must lay your eyes on.
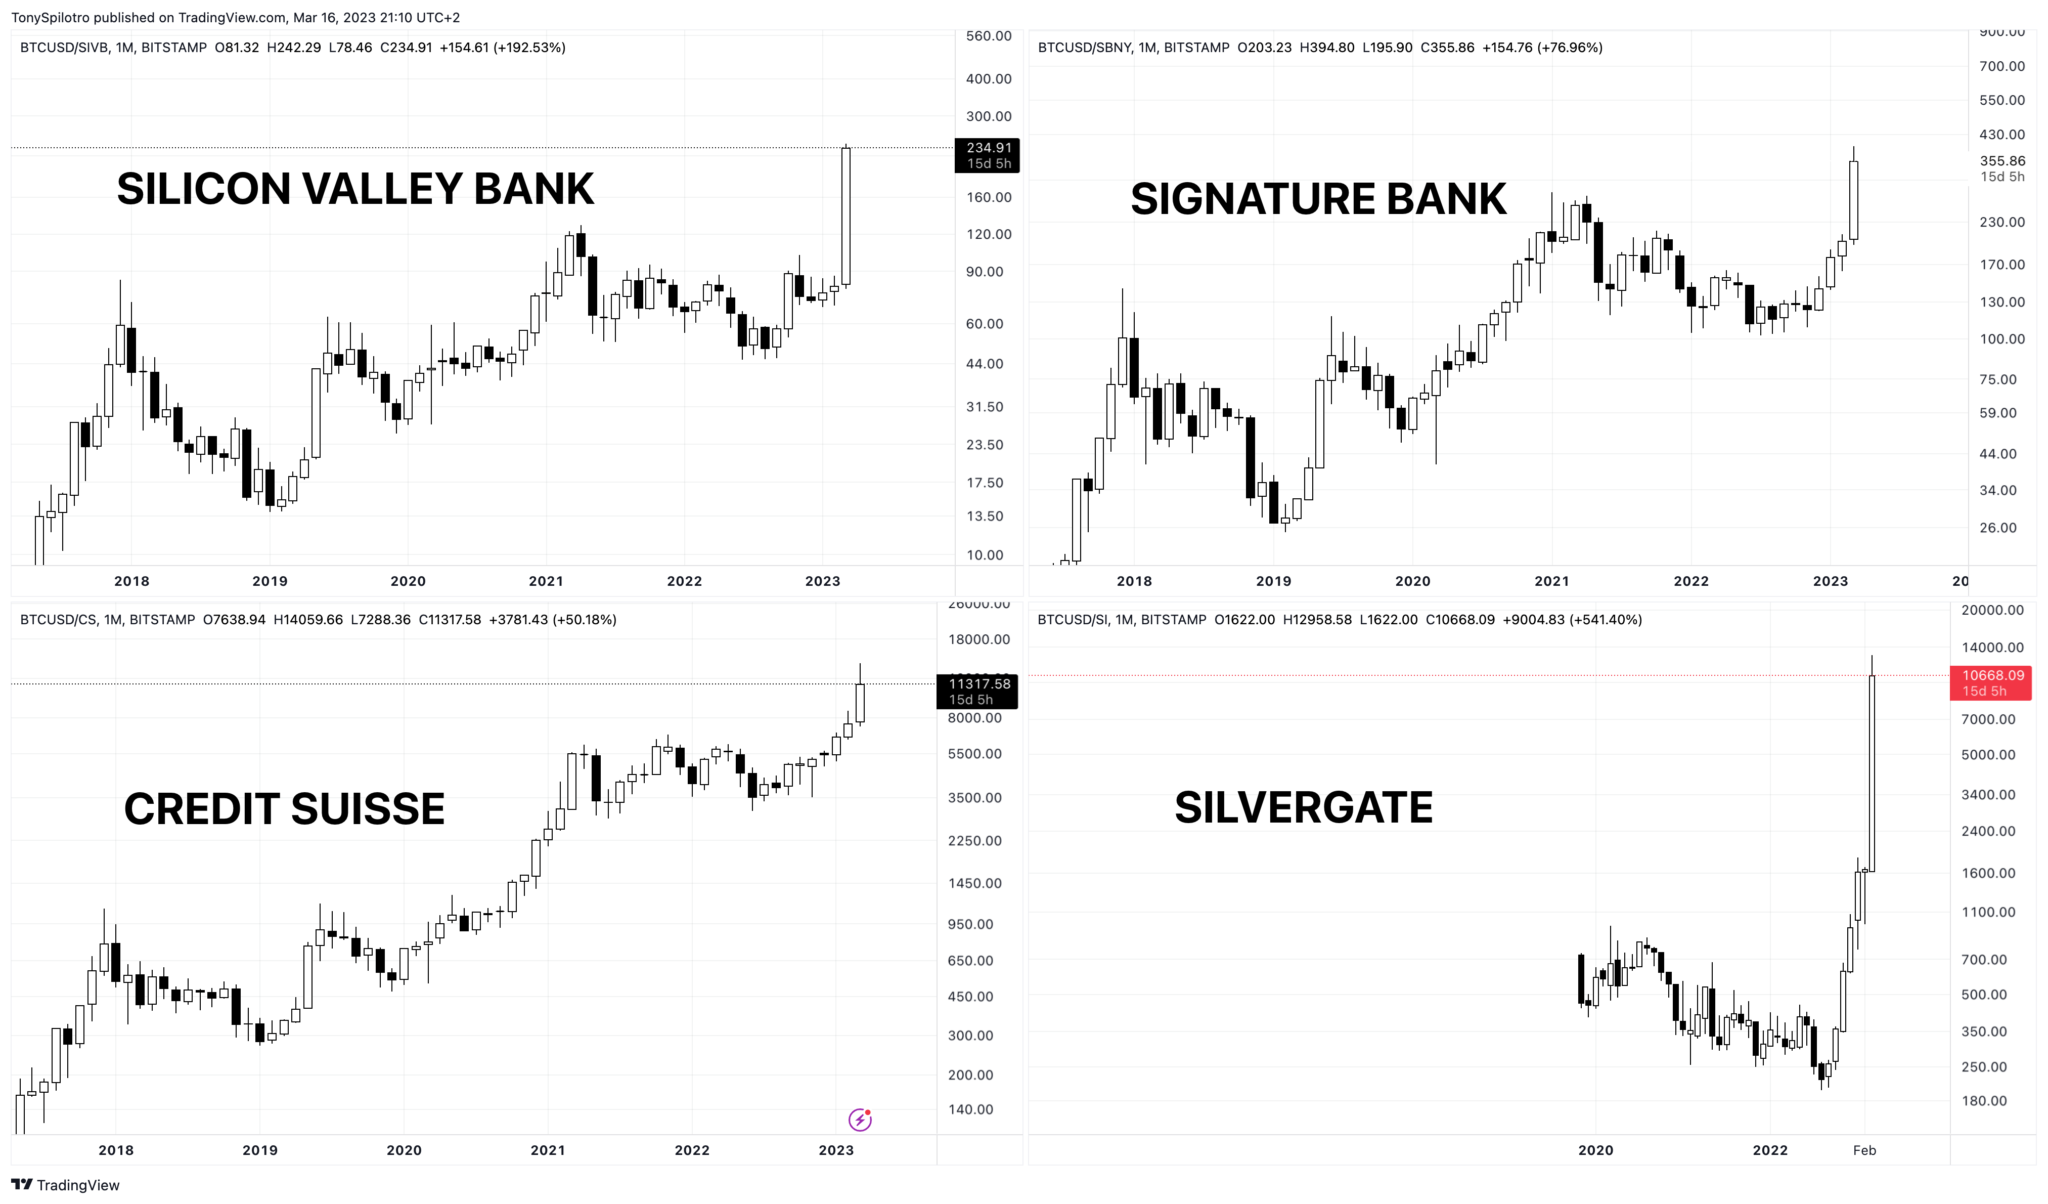
Bitcoin versus Banks | BTCUSD on TradingView.com
History In The Making As BTC Becomes The Answer
The monthly candles in the above chart in the chart above are especially impressive. BTCUSD increased 80% against CS shares, 95% against SBNY, 200% against SIVB shares, and a staggering 650% against Silvergate.
The last time BTCUSD rallied this hard against big banks was back in May of 2019. Bitcoin price saw its bear market bottom about five months before the big move versus banks. This cycle, BTCUSD made its most recent low in November 2022. Five months from then would be April 2023, and already we’re seeing massive movements against the banking sector once again. Could the outperformance against banks signal a potential bottom in the crypto market?
This isn’t the only way that the first ever crypto asset is beating banks. Even at prices of $25,000 per coin, Bitcoin has a larger market cap and total value than even the largest banks in the world, like JP Morgan Chase and Bank of America.
Will the dominoes continue to fall across the banking sector? And could this be the start of a new bullish narrative in Bitcoin? The next month will be pivotal in changing the trend across crypto.
#Bitcoin Versus Banks = Fatality pic.twitter.com/VIMUoc8hcX
— Tony "The Bull" (@tonythebullBTC) March 16, 2023