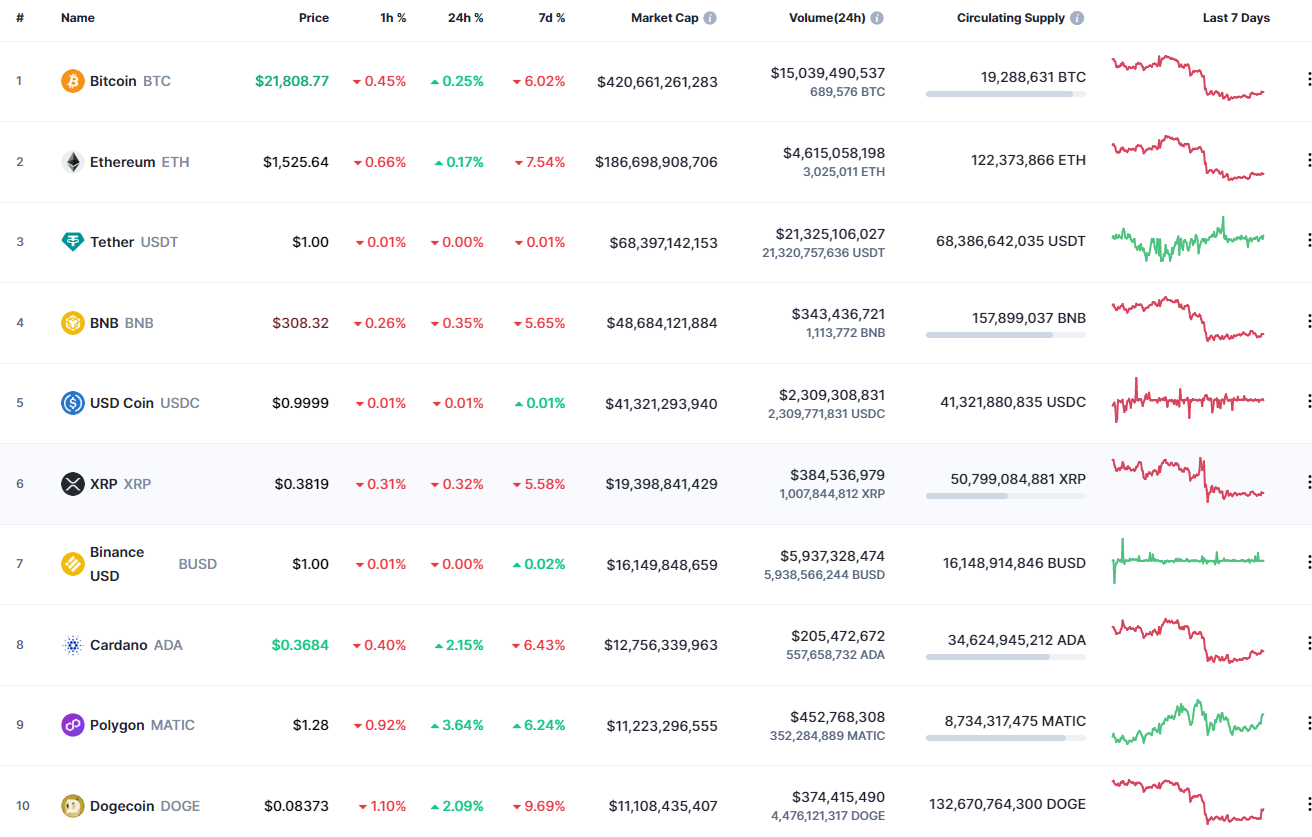
The correction continues on the cryptocurrency market as most of the coins are in the red zone.
BTC/USD
Bitcoin (BTC) is an exception, rising by 0.25% over the last 24 hours.
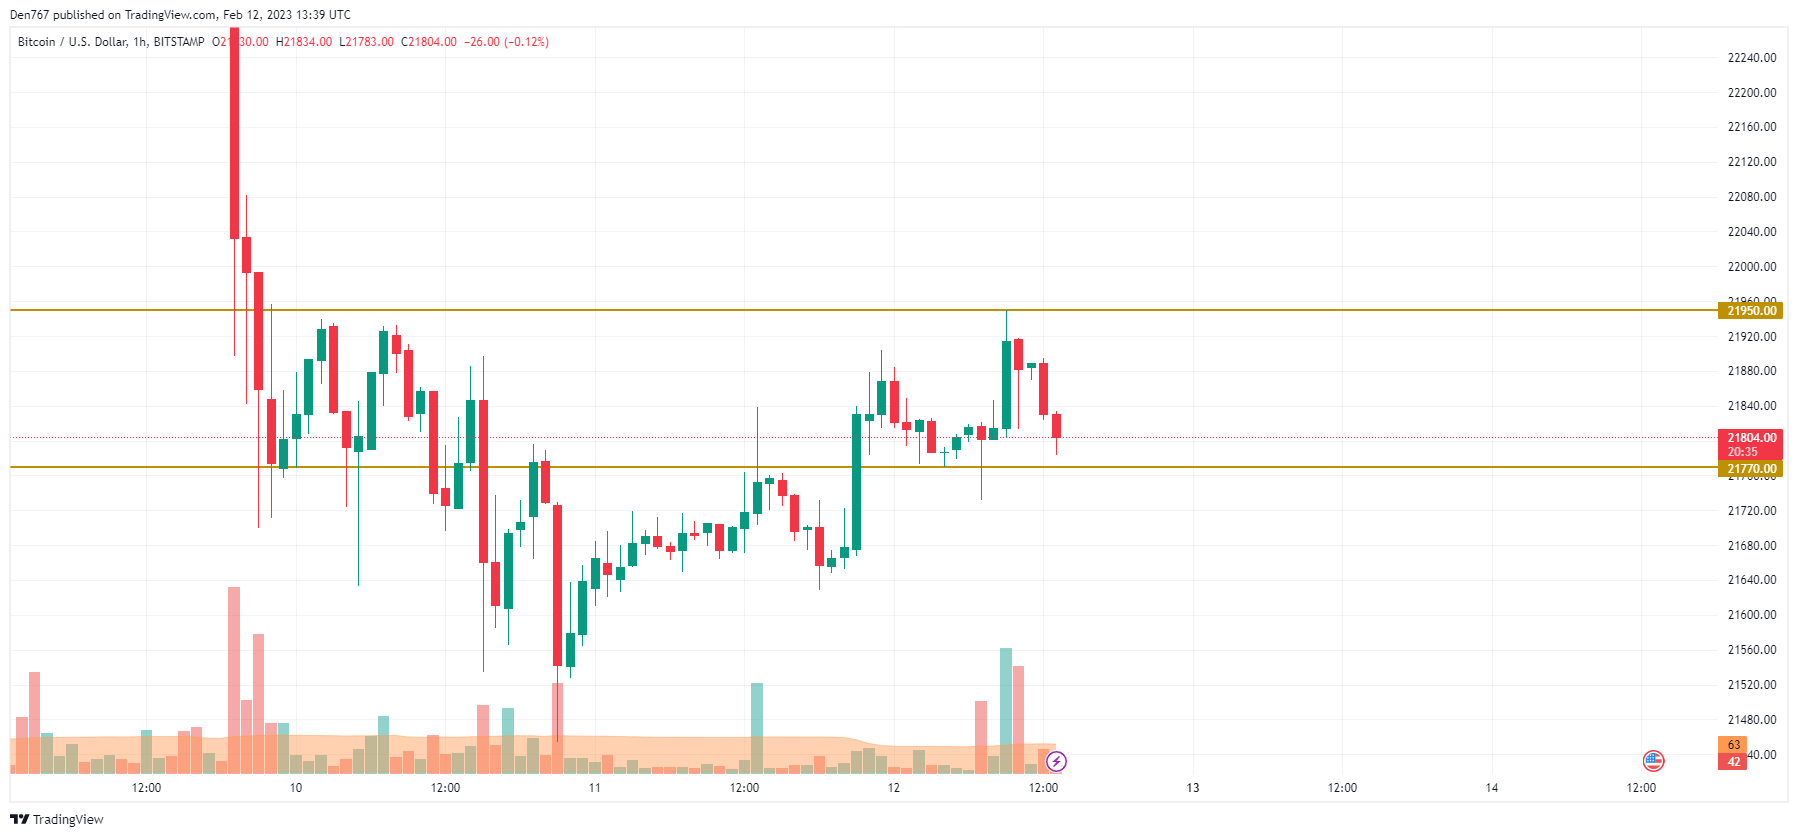
Despite the slight rise, Bitcoin (BTC) is looking bearish on the local chart as the rate is returning to the support level of $21,770. If closure happens near it, the breakout may lead to a further drop to the $21,600 zone shortly.
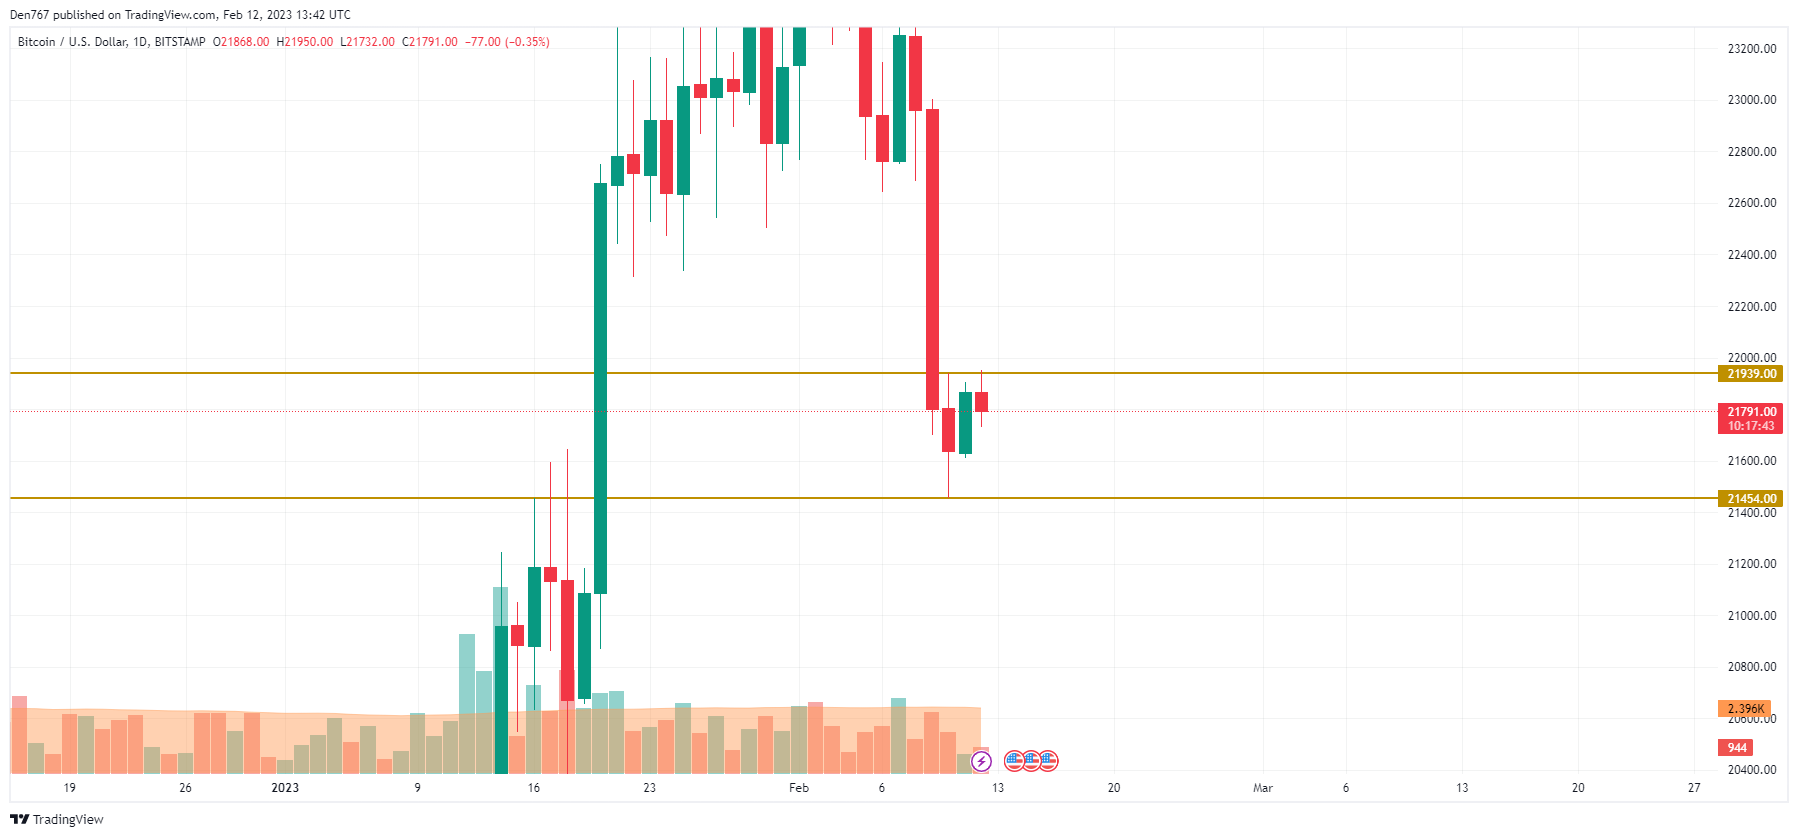
On the daily time frame, the price has made a false breakout of the resistance at $21,939 against low volume. If the situation does not change by the end of the day, the decline may continue to the middle of the channel around the $21,500-$21,600 zone. Such a scenario is relevant until the end of the week.
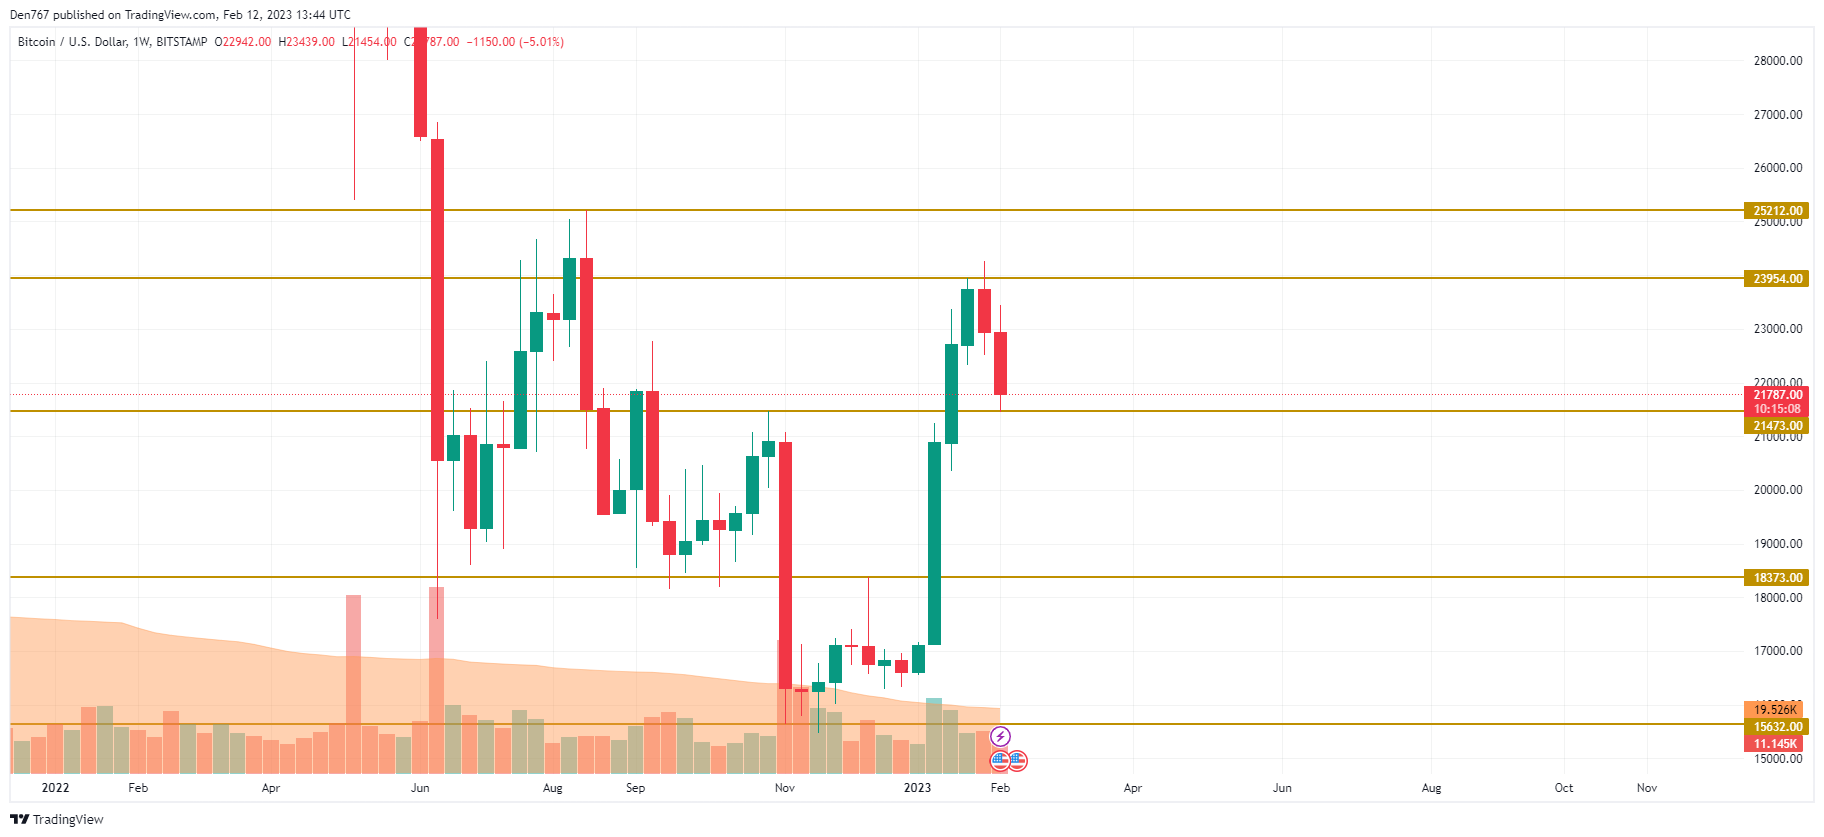
On the weekly chart, the rate of Bitcoin (BTC) has made a false breakout of the mirror level at $21,473, which means that the main coin might have found a local bottom and is ready to bounce back.
However, it is too early to think about a midterm reversal as BTC has not accumulated enough energy for that. In this regard, consolidation in the range of $21,800-$22,000 might be a possible scenario until the end of the month.
Bitcoin is trading at $21,803 at press time.