The Bitcoin (BTC) price shows signs of weakness in the short-term, but the long-term bullish trend remains intact.
An analysis of the different cohorts that hold Bitcoin shows that long-term holders are at a historic peak. Long-term holders are the addresses holding BTC for more than six months.
Currently, 78% of the total BTC supply is owned by long-term holders. Combined with the consistent outflow from exchanges, this could cause a supply squeeze, where the lack of available BTC can cause a bidding war and a surge in price.
In other Bitcoin news, MicroStrategy chairman Michael Saylor stated that he is still bullish on the digital asset and took jibes at other business leaders who are more skeptical. In some negative news, Billionaire investor Tim Draper visited the Central Bank of Sri Lanka in an attempt to promote Bitcoin and the improvement blockchain technology can provide to their financial system. However, he was met with deaf ears.
Bitcoin Price Resumes Ascent
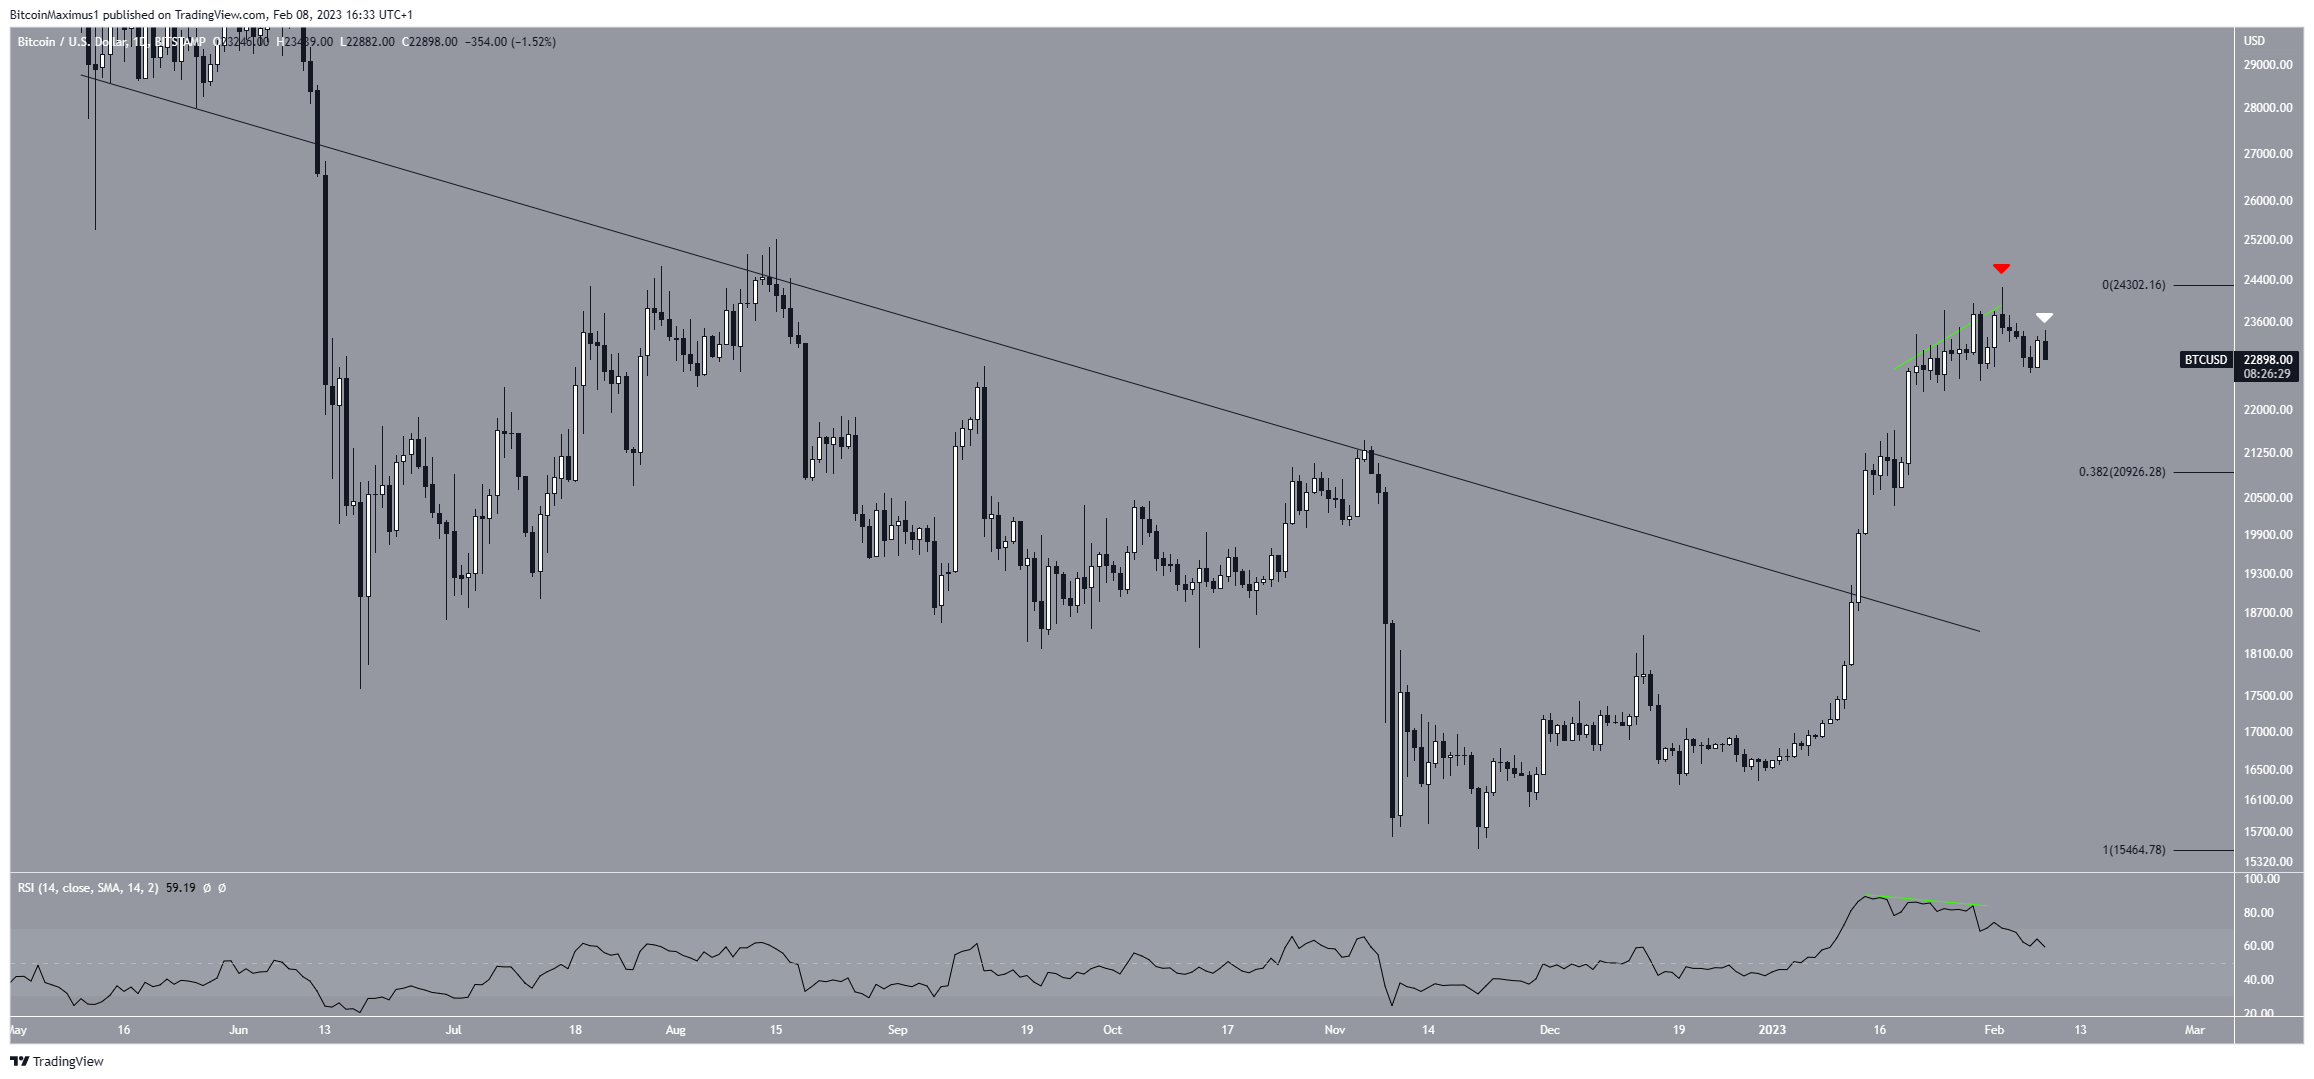
The BTC price has increased at an accelerated rate since the beginning of the year. It broke out from a descending resistance line on Jan. 13 and reached a high of $24,258 on Feb. 2. However, it created a bearish candlestick (red icon) the same day and has fallen since.
Furthermore, the daily RSI has generated bearish divergence (green line) inside the overbought territory. This is a sign that often precedes downward movements.
BTC is currently in the process of creating a bearish engulfing candlestick (white icon). If this occurs, it will confirm the short-term reversal and could lead to a retracement to the 0.382 Fib retracement support level at $20,926.
On the other hand, an increase above the Feb. 2 high of $24,258 would mean that the trend is still bullish and could lead to an upward movement toward $26,000.
Bitcoin Dominance Rate (BTCD) RSI Gives Bearish Signal
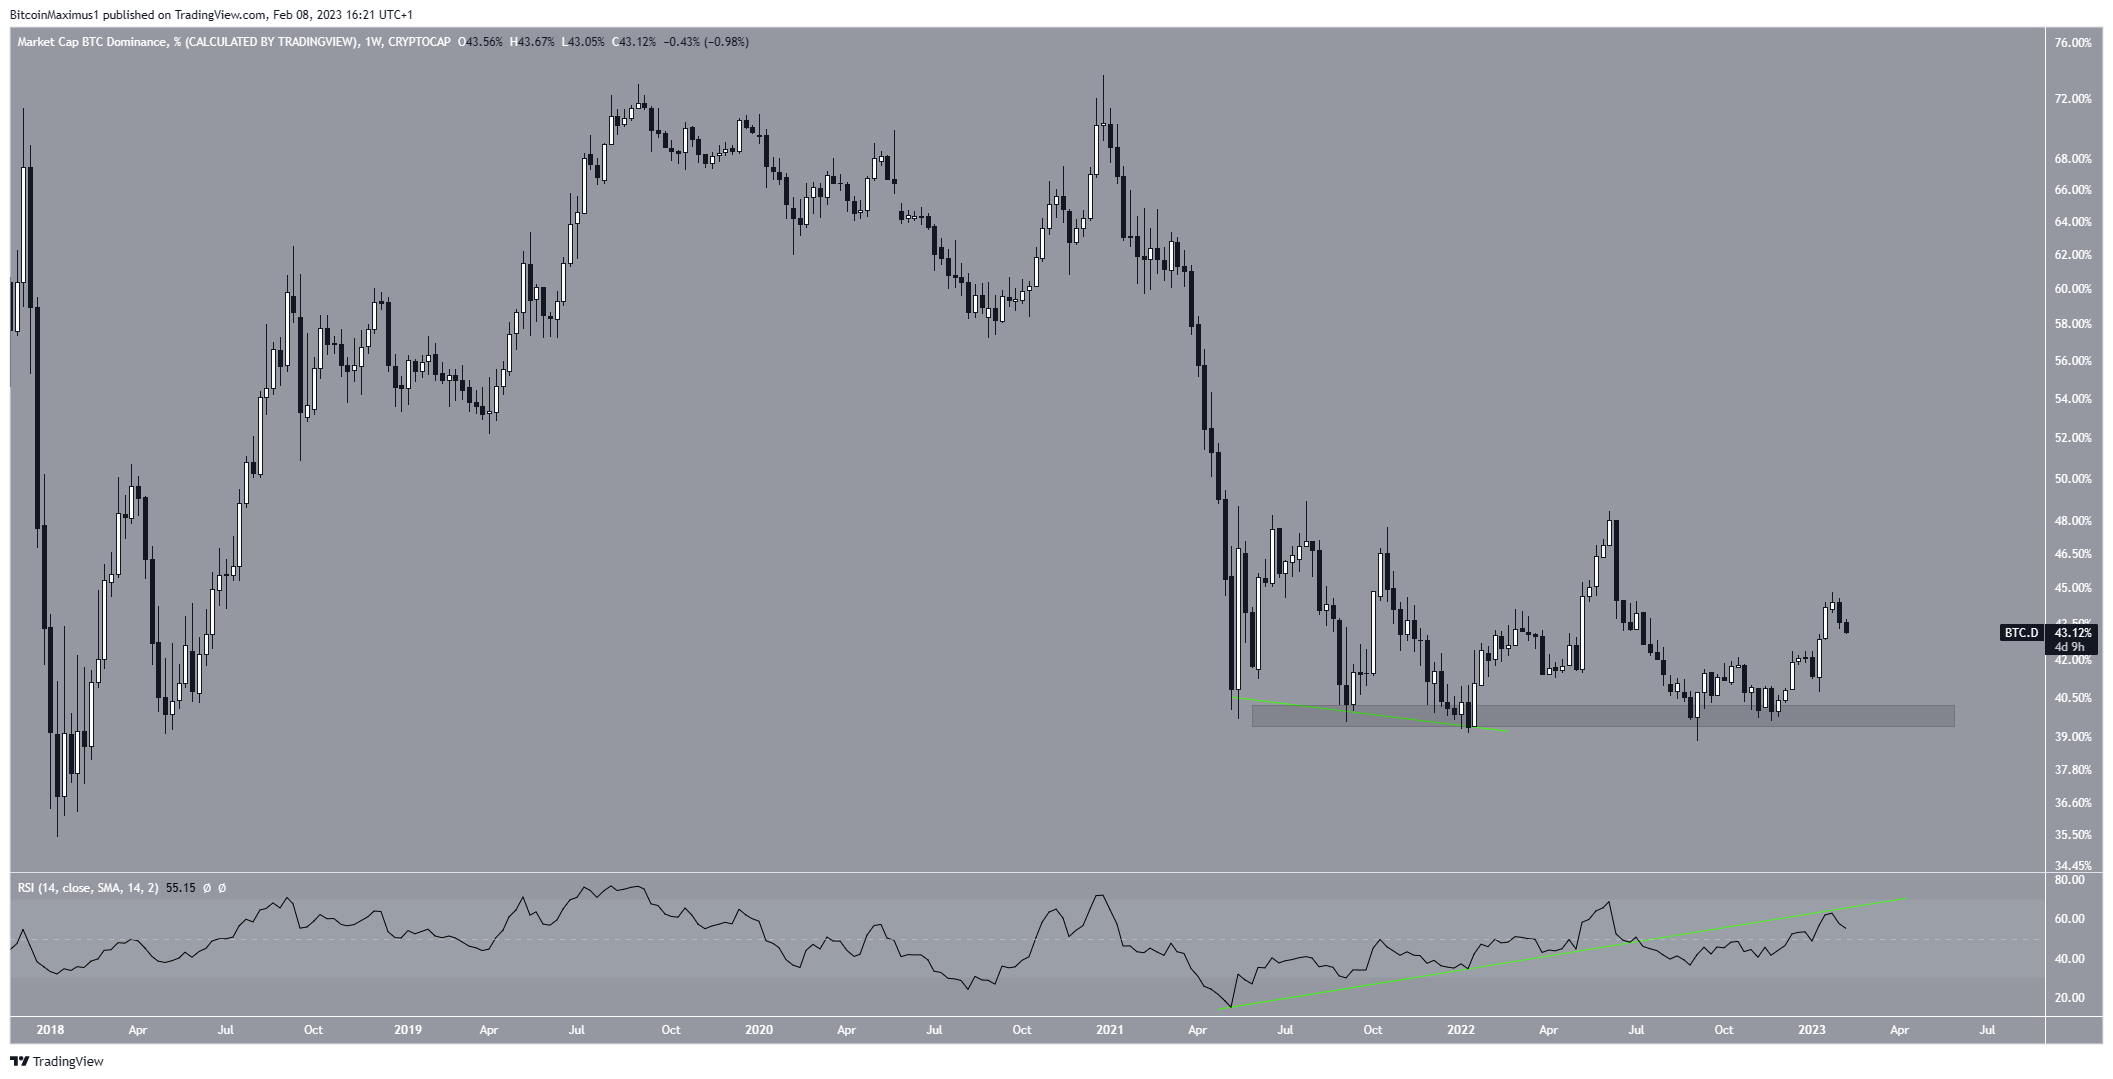
The Bitcoin Dominance Rate has increased since Sept. 2022. However, it created a bearish candlestick last week, which could signify things to come.
More importantly, the weekly RSI validated a bullish divergence trend line as resistance (red icon). The bullish divergence trend line catalyzed the current upward movement, and its breakdown and validation as resistance is a significant bearish signal.
Therefore, unless the RSI moved above this line or creates another bullish divergence, a BTCD decrease toward 40% and possibly 35% is expected. An RSI decrease and close below 50 would confirm this bearish forecast.
To conclude, the most likely Bitcoin price forecast is a decrease toward $20,926. Afterward, the upward movement can continue. An increase above the Feb. 3 high of $24,256 would invalidate this short-term bearish outlook and could lead to highs near $26,000.
For BeInCrypto’s latest crypto market analysis, click here.