Most of the coins might need a correction before the next wave of growth.
BTC/USD
Even though the price of Bitcoin (BTC) has dropped by 0.32% since yesterday, the rate has grown by more than 10% over the last week.
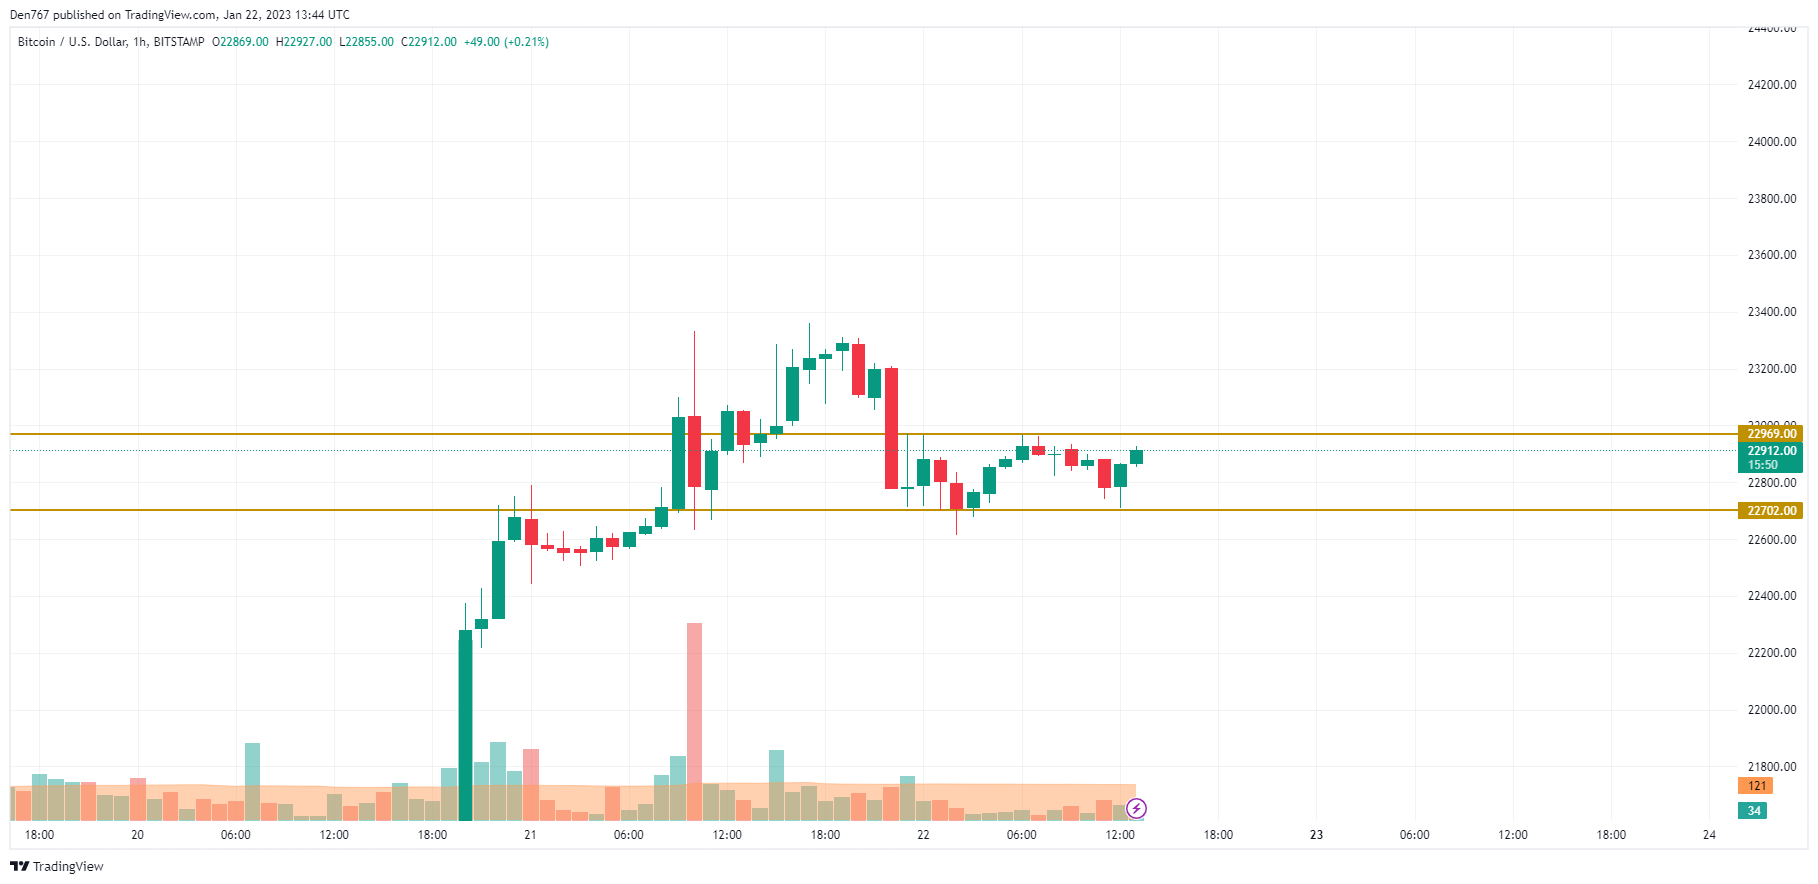
On the local chart, the price of Bitcoin (BTC) is in the narrow range between the support at $22,702 and the resistance at $22,969. At the moment, the rate is on the way to the upper line, which means that bulls are not going to give up.
In case of a breakout, the growth may continue to the $23,100-$23,200 zone.
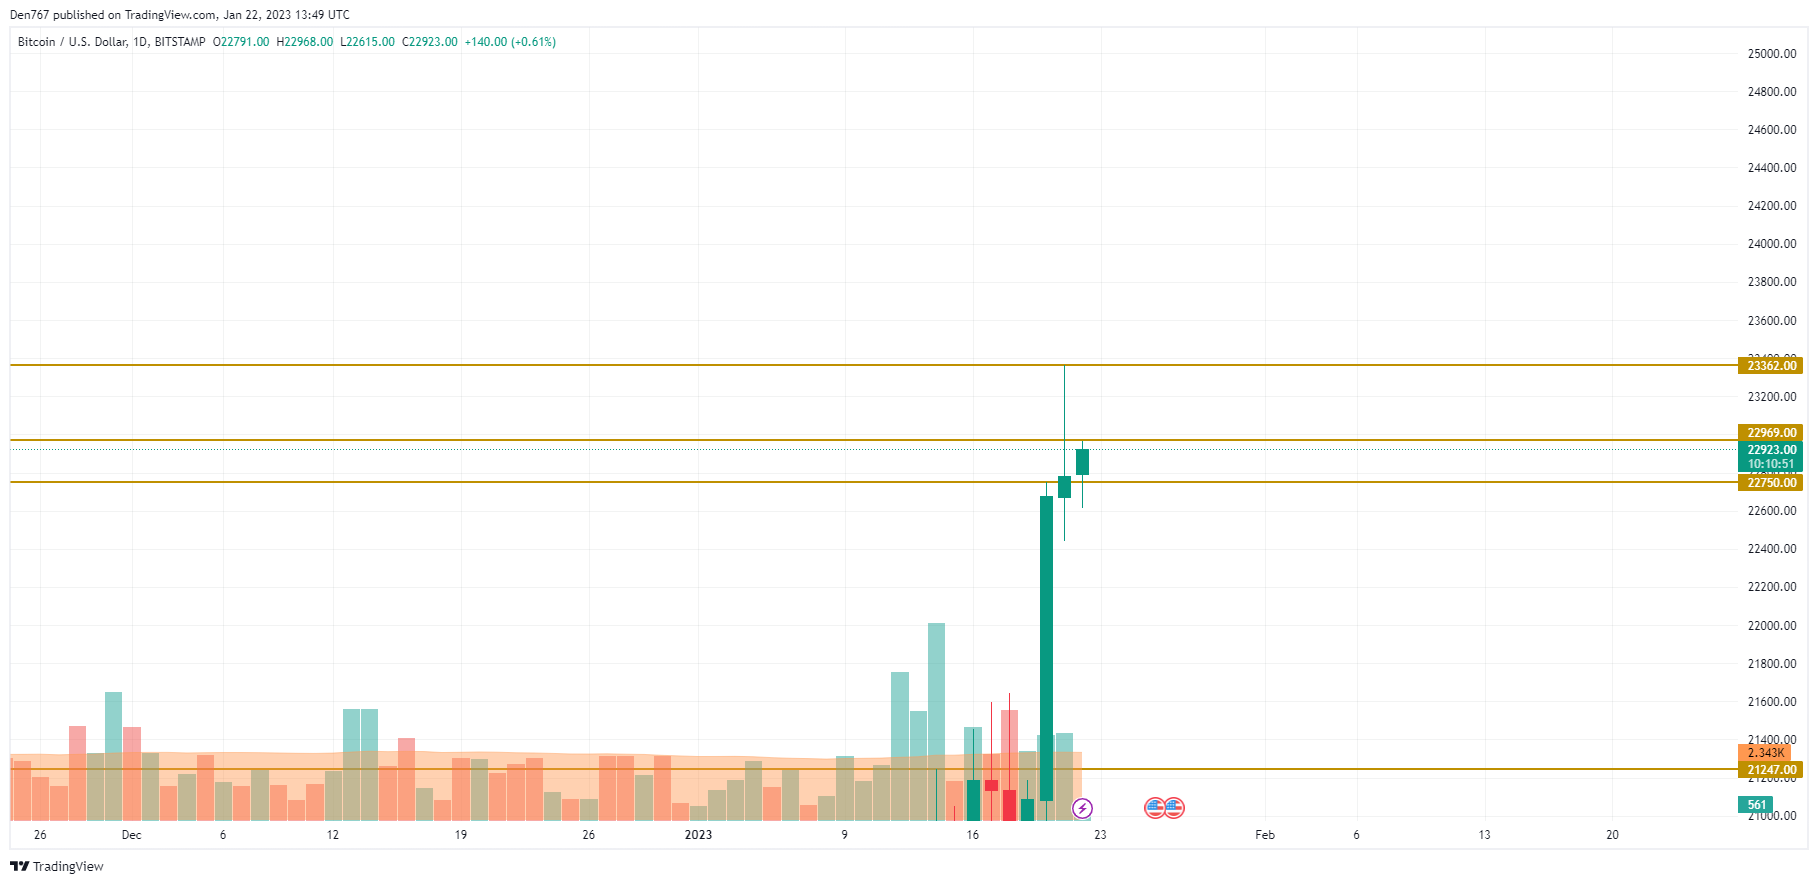
On the bigger time frame, the situation is also positive as the price has bounced back from the recently formed support level of $22,750. If closure happens near the important $23,000 zone, the upward move can continue to $23,362.
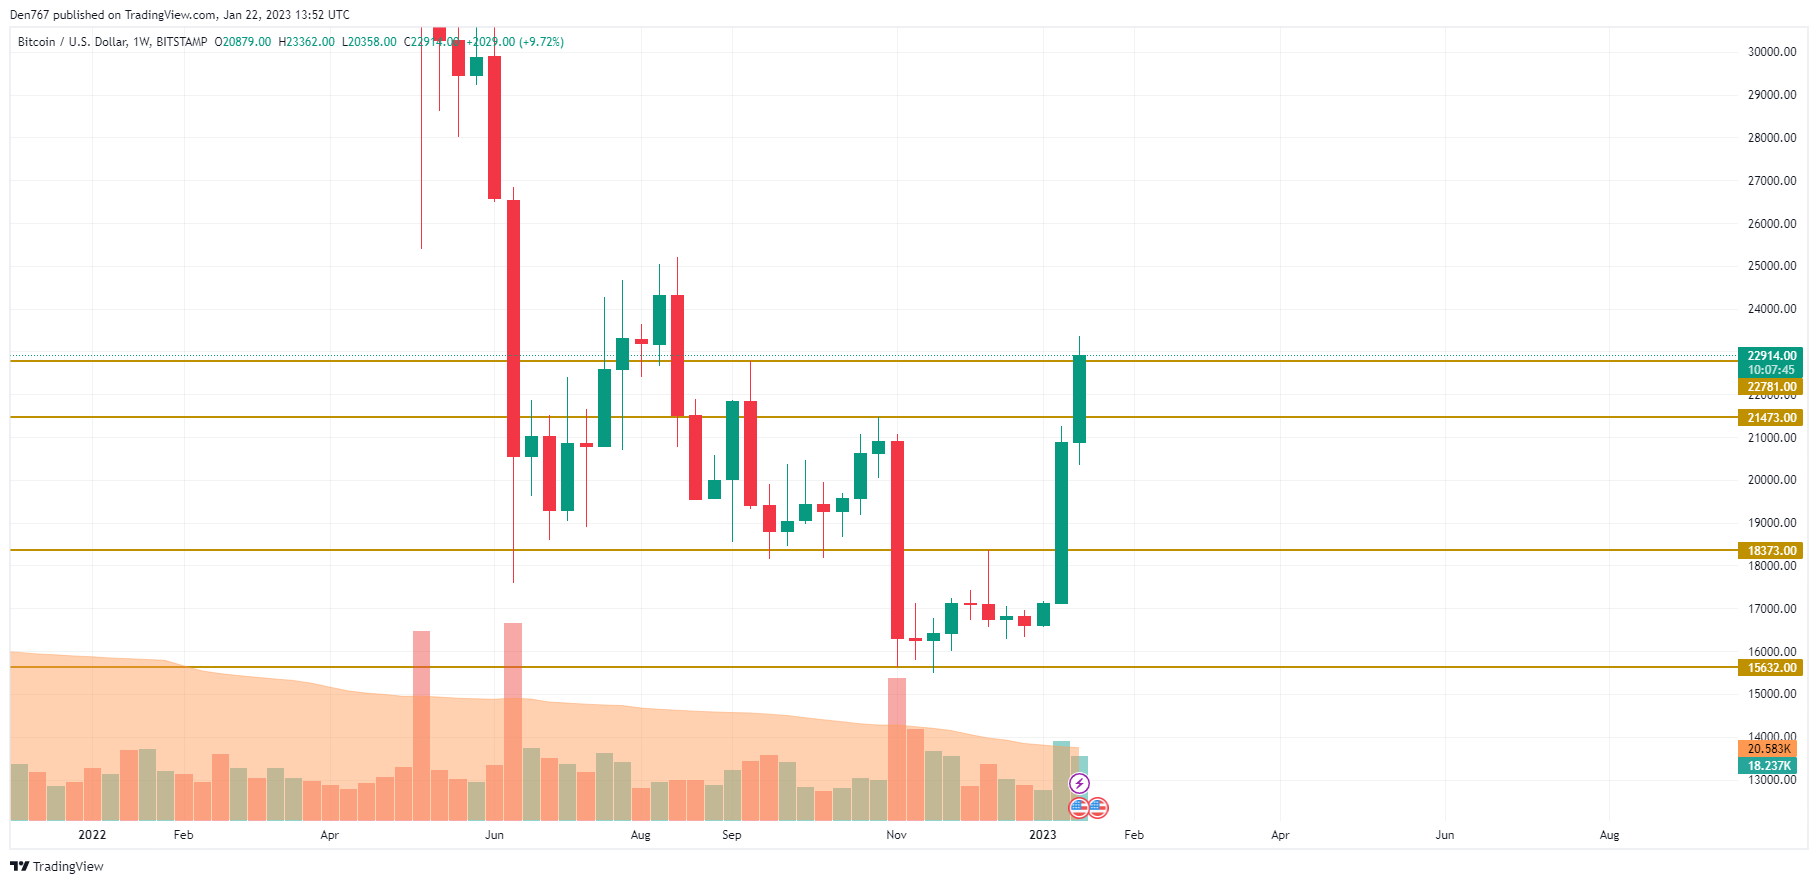
From the midterm point of view, the weekly candle is about to close above the $22,781 mark, which means that Bitcoin (BTC) remains bullish. In this regard, the energy might be enough for a move to the next resistance area of around $25,000.
Bitcoin is trading at $22,912 at press time.