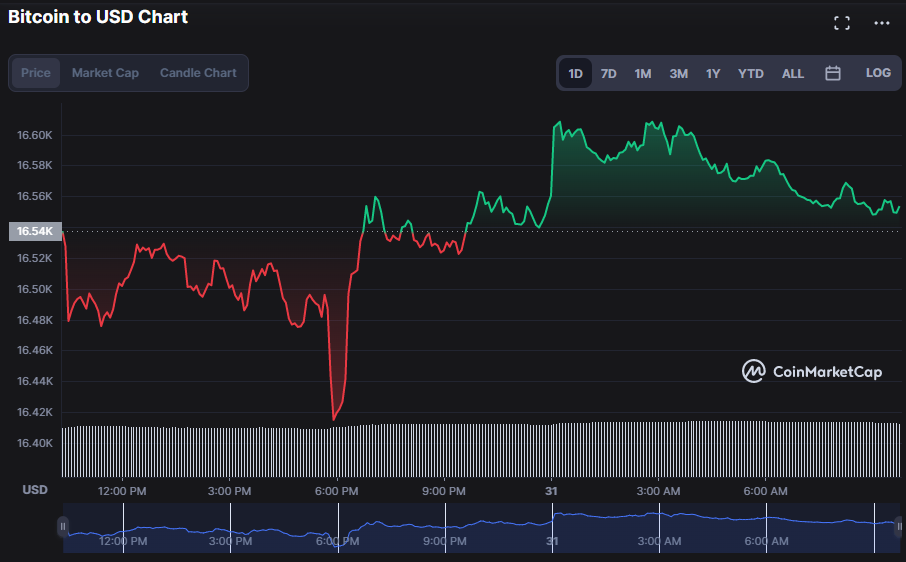
Following a plunge and sell-off in the early hours of the day, Bitcoin (BTC) bulls repudiated the negative trend by finding support at $16,408.48. This upbeat atmosphere pushed BTC prices higher, although they faced stiff resistance at $16,610.43. A break over this resistance level might result in more gains in the Bitcoin market.
The market capitalization and 24-hour trading volume of BTC both increased by 0.45% and 4.94%, respectively, to $318,623,150,035 and $15,082,574,535, signaling that buying pressure is intensifying.
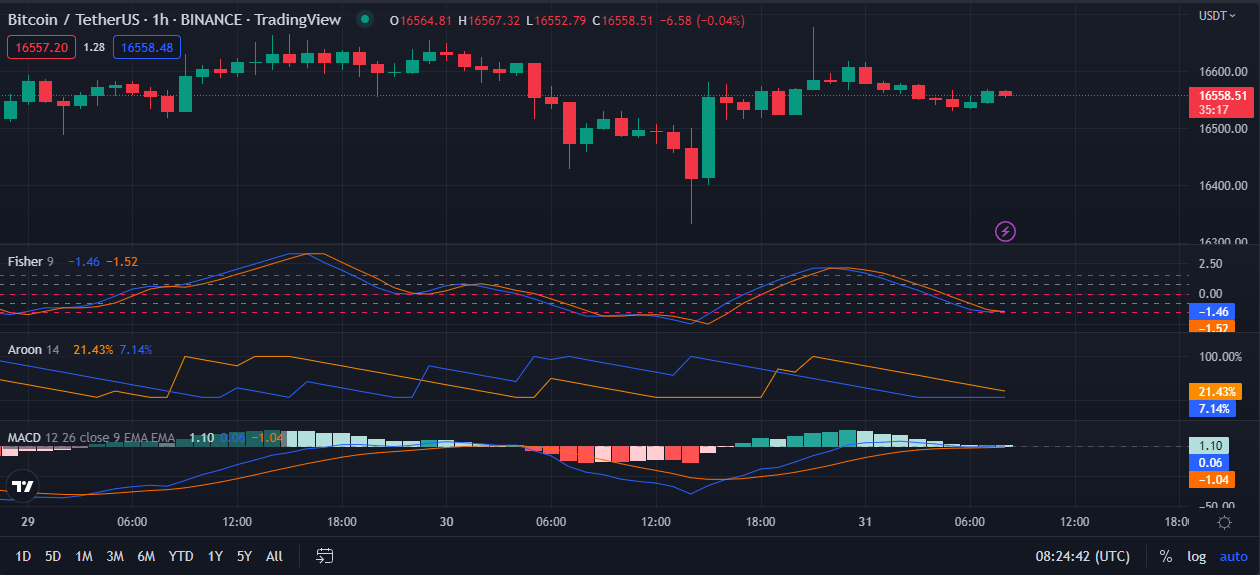
Due to the Fisher Transform’s bullish crossing above the signal line at -1.41, expectations of the market’s bullish dominance persisting for the foreseeable future are valid. Based on the trend of this Fisher Transform, traders are encouraged to buy as it indicates that bullish momentum is increasing. However, its recent movement into negative territory has traders worried that the current positive trend may be temporary.
A fresh upswing is set to begin when the Aroon-Up crosses above the Aroon-Down. As shown on the BTC price chart, the current bull run has not yet hit its peak since the aroon up (orange) with a value of 21.43% crosses over the aroon down (blue) with a value of 7.14%. This motion suggests bull strength may persist since bears are weary.
However, the MACD blue line’s recent dip into the negative zone (with a value of -0.18) should cause concern among traders since it indicates a possible reversal. This gloomy outlook is being tamped down by the fact that it is rising, leaving negative territory, and crossing the signal line.
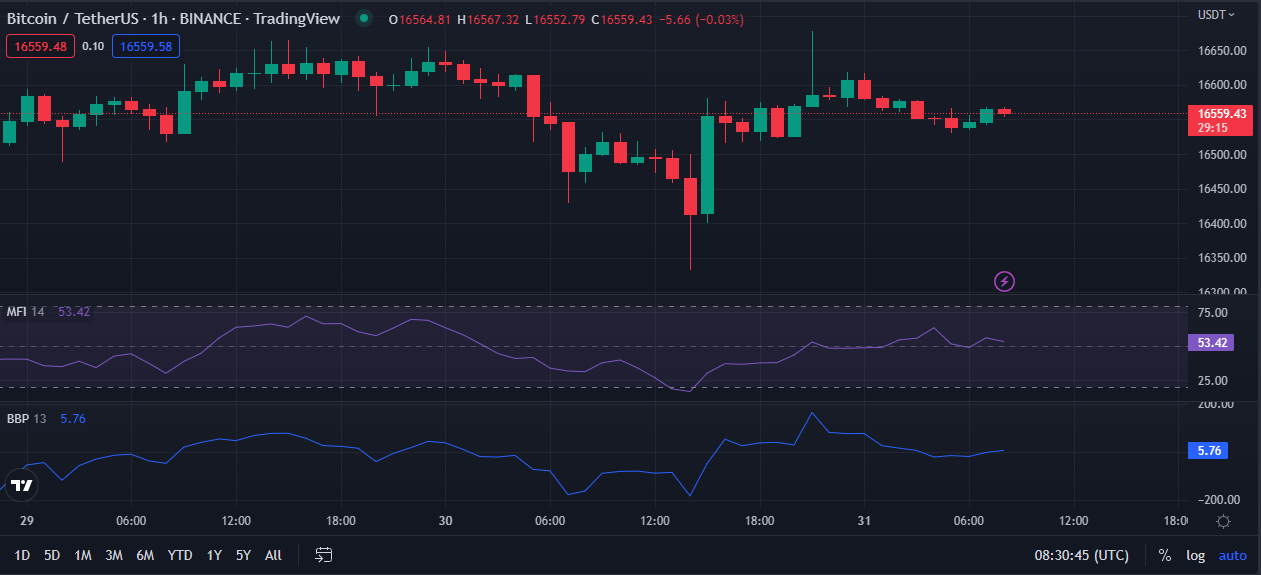
Overbought levels (above 80) and oversold levels (below 30) on the Money Flow Index (MFI) lead traders to anticipate reversals and initiate selling. Therefore, investors should exercise caution in the near term as the BTC price chart (with an MFI of 49.92 and a downward trend) approaches the oversold area. Recent values, however, indicate that the market is rather calm, while price changes might go either way.
Investors in Bitcoin (BTC) should take heart from the fact that the Bull Bear Strength (BBS) has moved into the positive zone, where it now sits at 6.23.
Bitcoin (BTC) bulls must maintain prices above the resistance level for trade to continue to rise.