
The crypto market leader, Bitcoin (BTC), has seen its price drop 1.58% over the last 24 hours according to the crypto market tracking website, CoinMarketCap. At press time, BTC is changing hands at $16,618.67.
After establishing a daily high at $16,895.28, BTC’s price has since declined to its current level. BTC’s 24-hour low sits at $16,608.18. Meanwhile, the daily trading volume for BTC has risen 34.41% – taking the total volume for the day to $16,752,177,832.
Santiment, the blockchain analysis firm, tweeted this morning that BTC’s ranging prices have a lot to do with declining whale interest.
 BTC" class="wp-image-237282 entered lazyloaded td-animation-stack-type0-2" width="731" height="558" data-lazy-srcset="https://coinedition.com/wp-content/uploads/2022/12/image-260.png 975w, https://coinedition.com/wp-content/uploads/2022/12/image-260-300x229.png 300w, https://coinedition.com/wp-content/uploads/2022/12/image-260-380x290.png 380w, https://coinedition.com/wp-content/uploads/2022/12/image-260-768x586.png 768w, https://coinedition.com/wp-content/uploads/2022/12/image-260-150x114.png 150w, https://coinedition.com/wp-content/uploads/2022/12/image-260-600x458.png 600w, https://coinedition.com/wp-content/uploads/2022/12/image-260-696x531.png 696w" data-lazy-sizes="(max-width: 731px) 100vw, 731px" data-lazy-src="https://coinedition.com/wp-content/uploads/2022/12/image-260.png" data-ll-status="loaded" sizes="(max-width: 731px) 100vw, 731px" srcset="https://coinedition.com/wp-content/uploads/2022/12/image-260.png 975w, https://coinedition.com/wp-content/uploads/2022/12/image-260-300x229.png 300w, https://coinedition.com/wp-content/uploads/2022/12/image-260-380x290.png 380w, https://coinedition.com/wp-content/uploads/2022/12/image-260-768x586.png 768w, https://coinedition.com/wp-content/uploads/2022/12/image-260-150x114.png 150w, https://coinedition.com/wp-content/uploads/2022/12/image-260-600x458.png 600w, https://coinedition.com/wp-content/uploads/2022/12/image-260-696x531.png 696w">
According to the chart shared by Santiment, the price of BTC and $1M+ valued whale transactions are closely correlated. The tweet concluded that a continued slide in BTC’s price and a spike in whale interest will be a historic bullish signal that investors and traders need to keep note of.
 BTC-USDT" class="wp-image-237287 td-animation-stack-type0-2 entered lazyloaded" width="731" height="431" data-lazy-srcset="https://coinedition.com/wp-content/uploads/2022/12/image-261.png 975w, https://coinedition.com/wp-content/uploads/2022/12/image-261-300x177.png 300w, https://coinedition.com/wp-content/uploads/2022/12/image-261-380x224.png 380w, https://coinedition.com/wp-content/uploads/2022/12/image-261-768x453.png 768w, https://coinedition.com/wp-content/uploads/2022/12/image-261-150x88.png 150w, https://coinedition.com/wp-content/uploads/2022/12/image-261-600x354.png 600w, https://coinedition.com/wp-content/uploads/2022/12/image-261-696x410.png 696w" data-lazy-sizes="(max-width: 731px) 100vw, 731px" data-lazy-src="https://coinedition.com/wp-content/uploads/2022/12/image-261.png" data-ll-status="loaded" sizes="(max-width: 731px) 100vw, 731px" srcset="https://coinedition.com/wp-content/uploads/2022/12/image-261.png 975w, https://coinedition.com/wp-content/uploads/2022/12/image-261-300x177.png 300w, https://coinedition.com/wp-content/uploads/2022/12/image-261-380x224.png 380w, https://coinedition.com/wp-content/uploads/2022/12/image-261-768x453.png 768w, https://coinedition.com/wp-content/uploads/2022/12/image-261-150x88.png 150w, https://coinedition.com/wp-content/uploads/2022/12/image-261-600x354.png 600w, https://coinedition.com/wp-content/uploads/2022/12/image-261-696x410.png 696w">
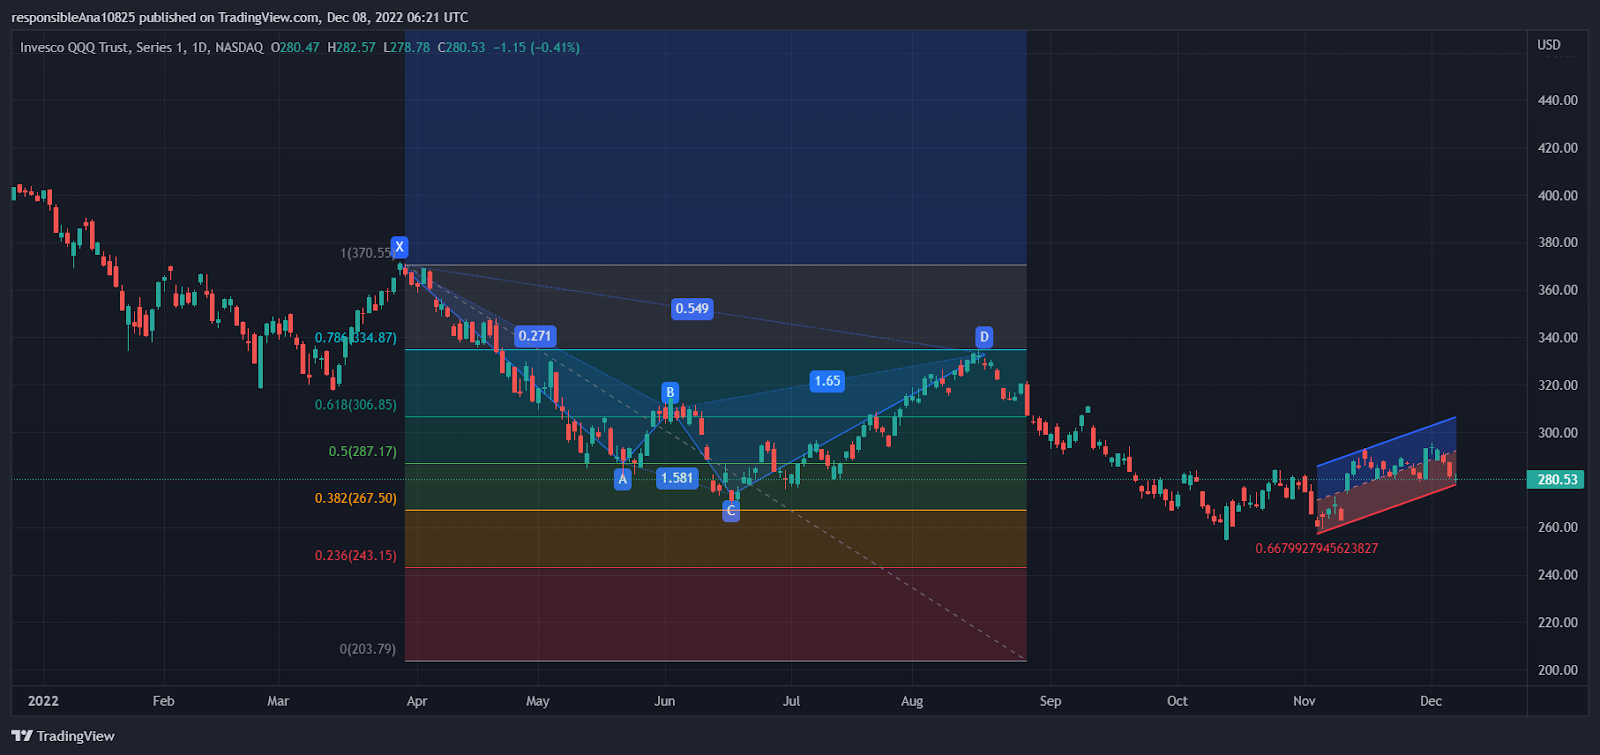
The price of BTC has dropped below the 9-day and 20-day EMA lines after a failed attempt at breaking above the two lines in the last 48 hours. BTC’s price has been in a narrow consolidation channel between $16,564.94 and $16,952.00.
Technical indicators on BTC’s daily chart suggest that bears still have a slight upper hand. The first bearish technical indicator is the relative positions of the 9 and 20-day EMA lines. Currently, the 9-day EMA line is positioned below the 20-day EMA line. In addition to this, the 9-day EMA line is breaking away below the 20-day EMA line.
The daily RSI line is also positioned below the daily RSI SMA line and is sloped negatively toward oversold territory.