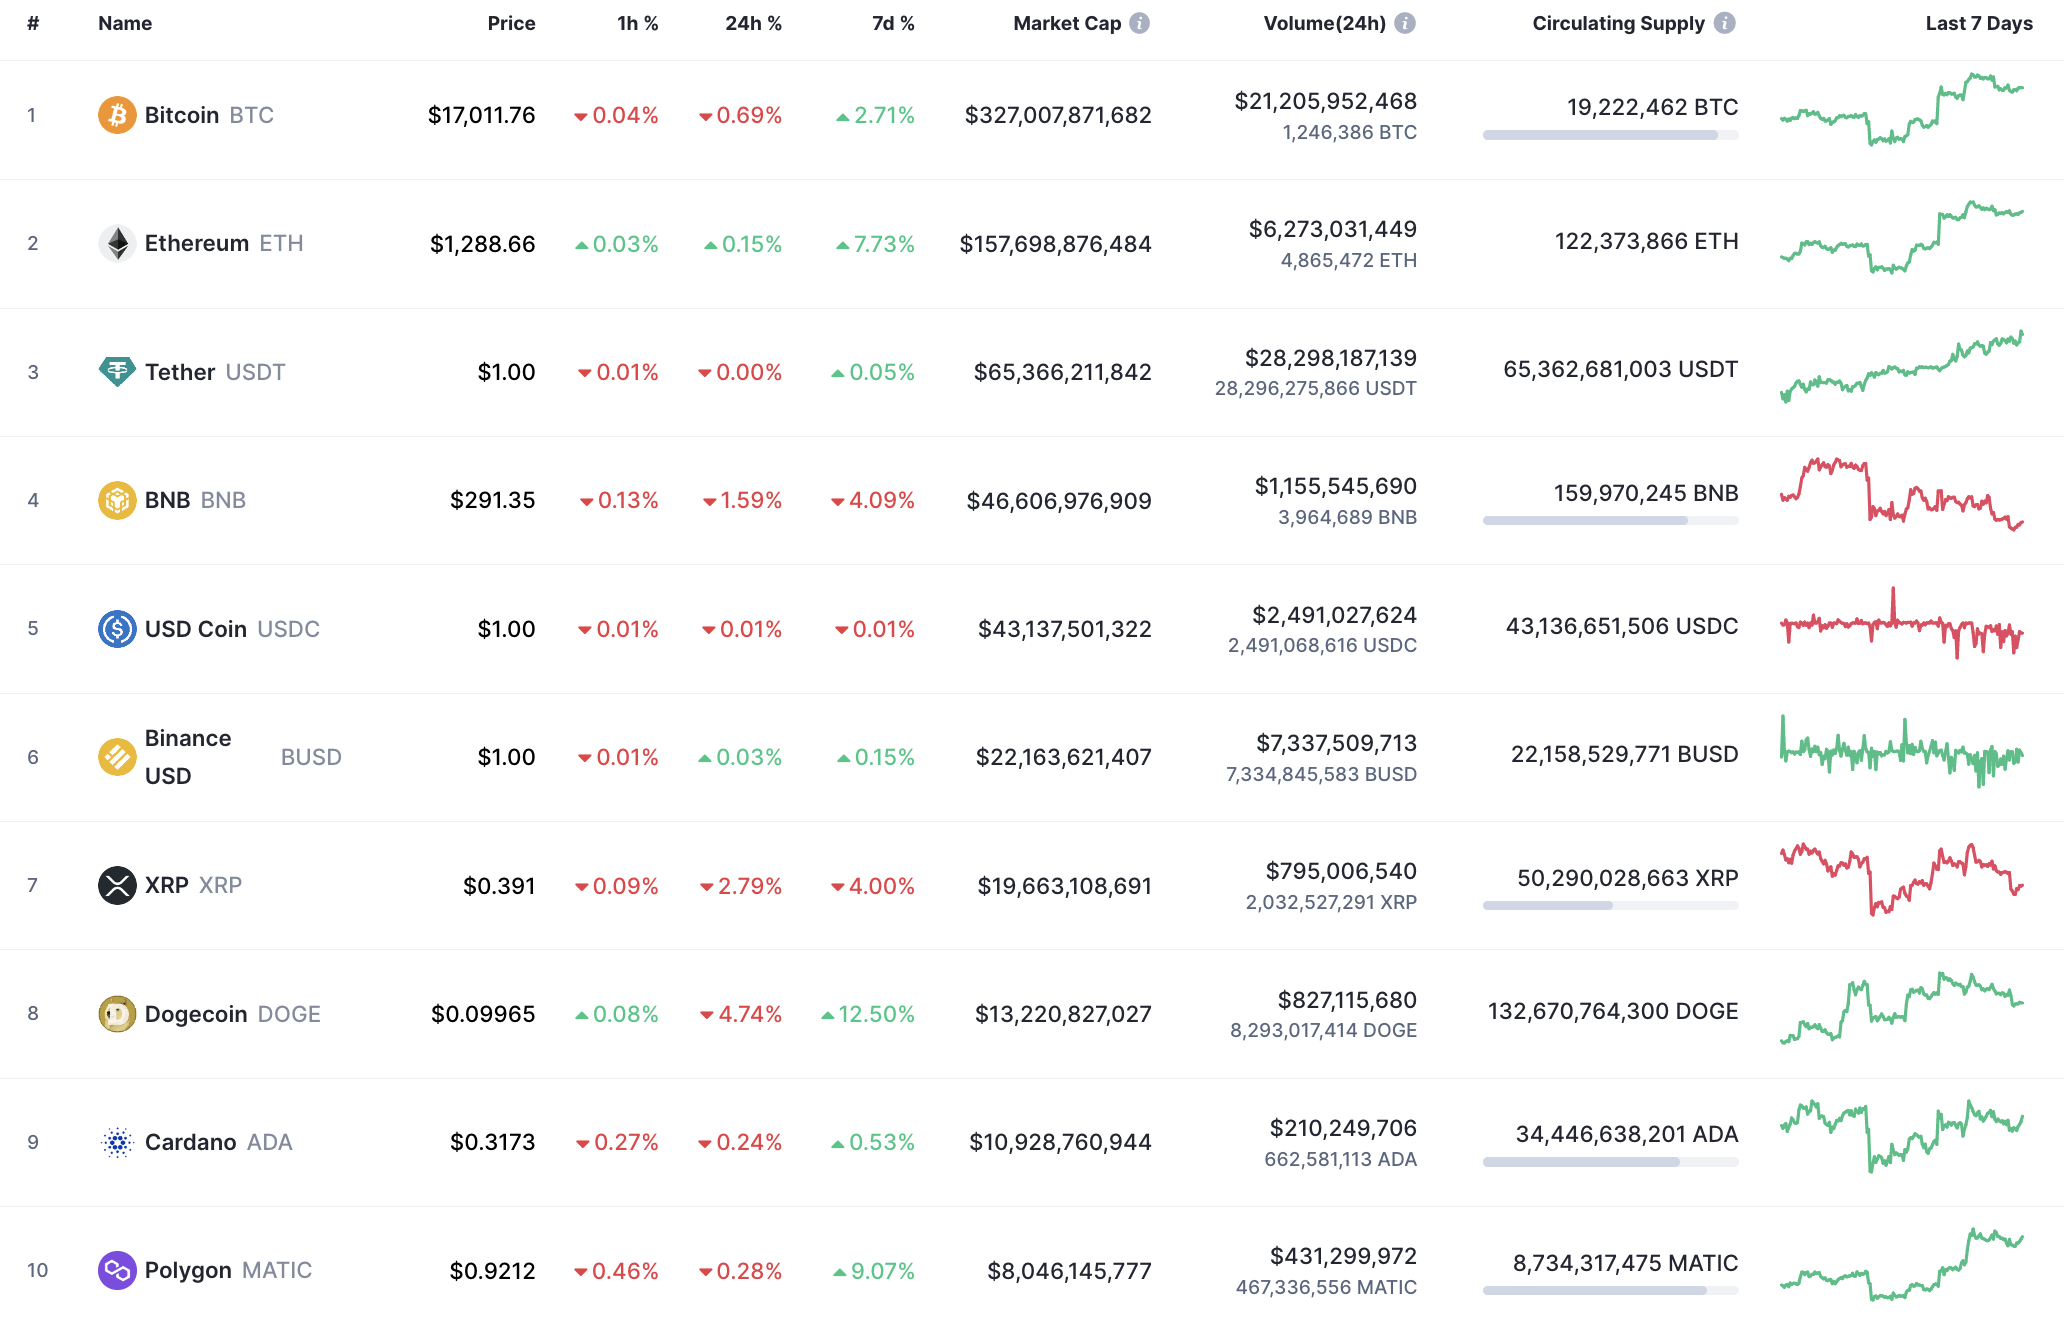
Most of the coins could not come back to the bullish trend, according to the CoinMarketCap ranking.
BTC/USD
The rate of Bitcoin (BTC) has dropped by 0.69% over the past 24 hours.
BTC/USD chart by TradingView" src="https://cnews24.ru/uploads/464/464896b36056beebdbab5e2ee0019fac0d13d399.png" size="2708x1320">
On the hourly chart, Bitcoin (BTC) has come back to the local support level of $16,866. If buyers cannot hold it, the fall may lead to the test of the $16,600-$16,700 zone tomorrow.
In addition, the selling volume is high, which means that bears are controlling the situation.
BTC/USD chart by TradingView" src="https://cnews24.ru/uploads/e28/e28919813559c3fcb0b077bd7d7c6fbae0690c31.png" size="2708x1320">
On the daily time frame, Bitcoin (BTC) is not as bullish as before as buyers lost the vital $17,000 level. If sellers' pressure continues, the decline may continue to the $16,500 area within the next few days.
BTC/USD chart by TradingView" src="https://cnews24.ru/uploads/ae1/ae1862e1d4787c7aee9cbcc58aa7648e5419a7a8.png" size="2708x1320">
From the midterm point of view, Bitcoin (BTC) is about to close the candle above the previous one, which offers hope for a slight rise. At the moment, traders should pay attention to the $17,000 mark, the breakout of which can be a prerequisite for growth to $18,000.
Bitcoin is trading at $16,883 at press time.