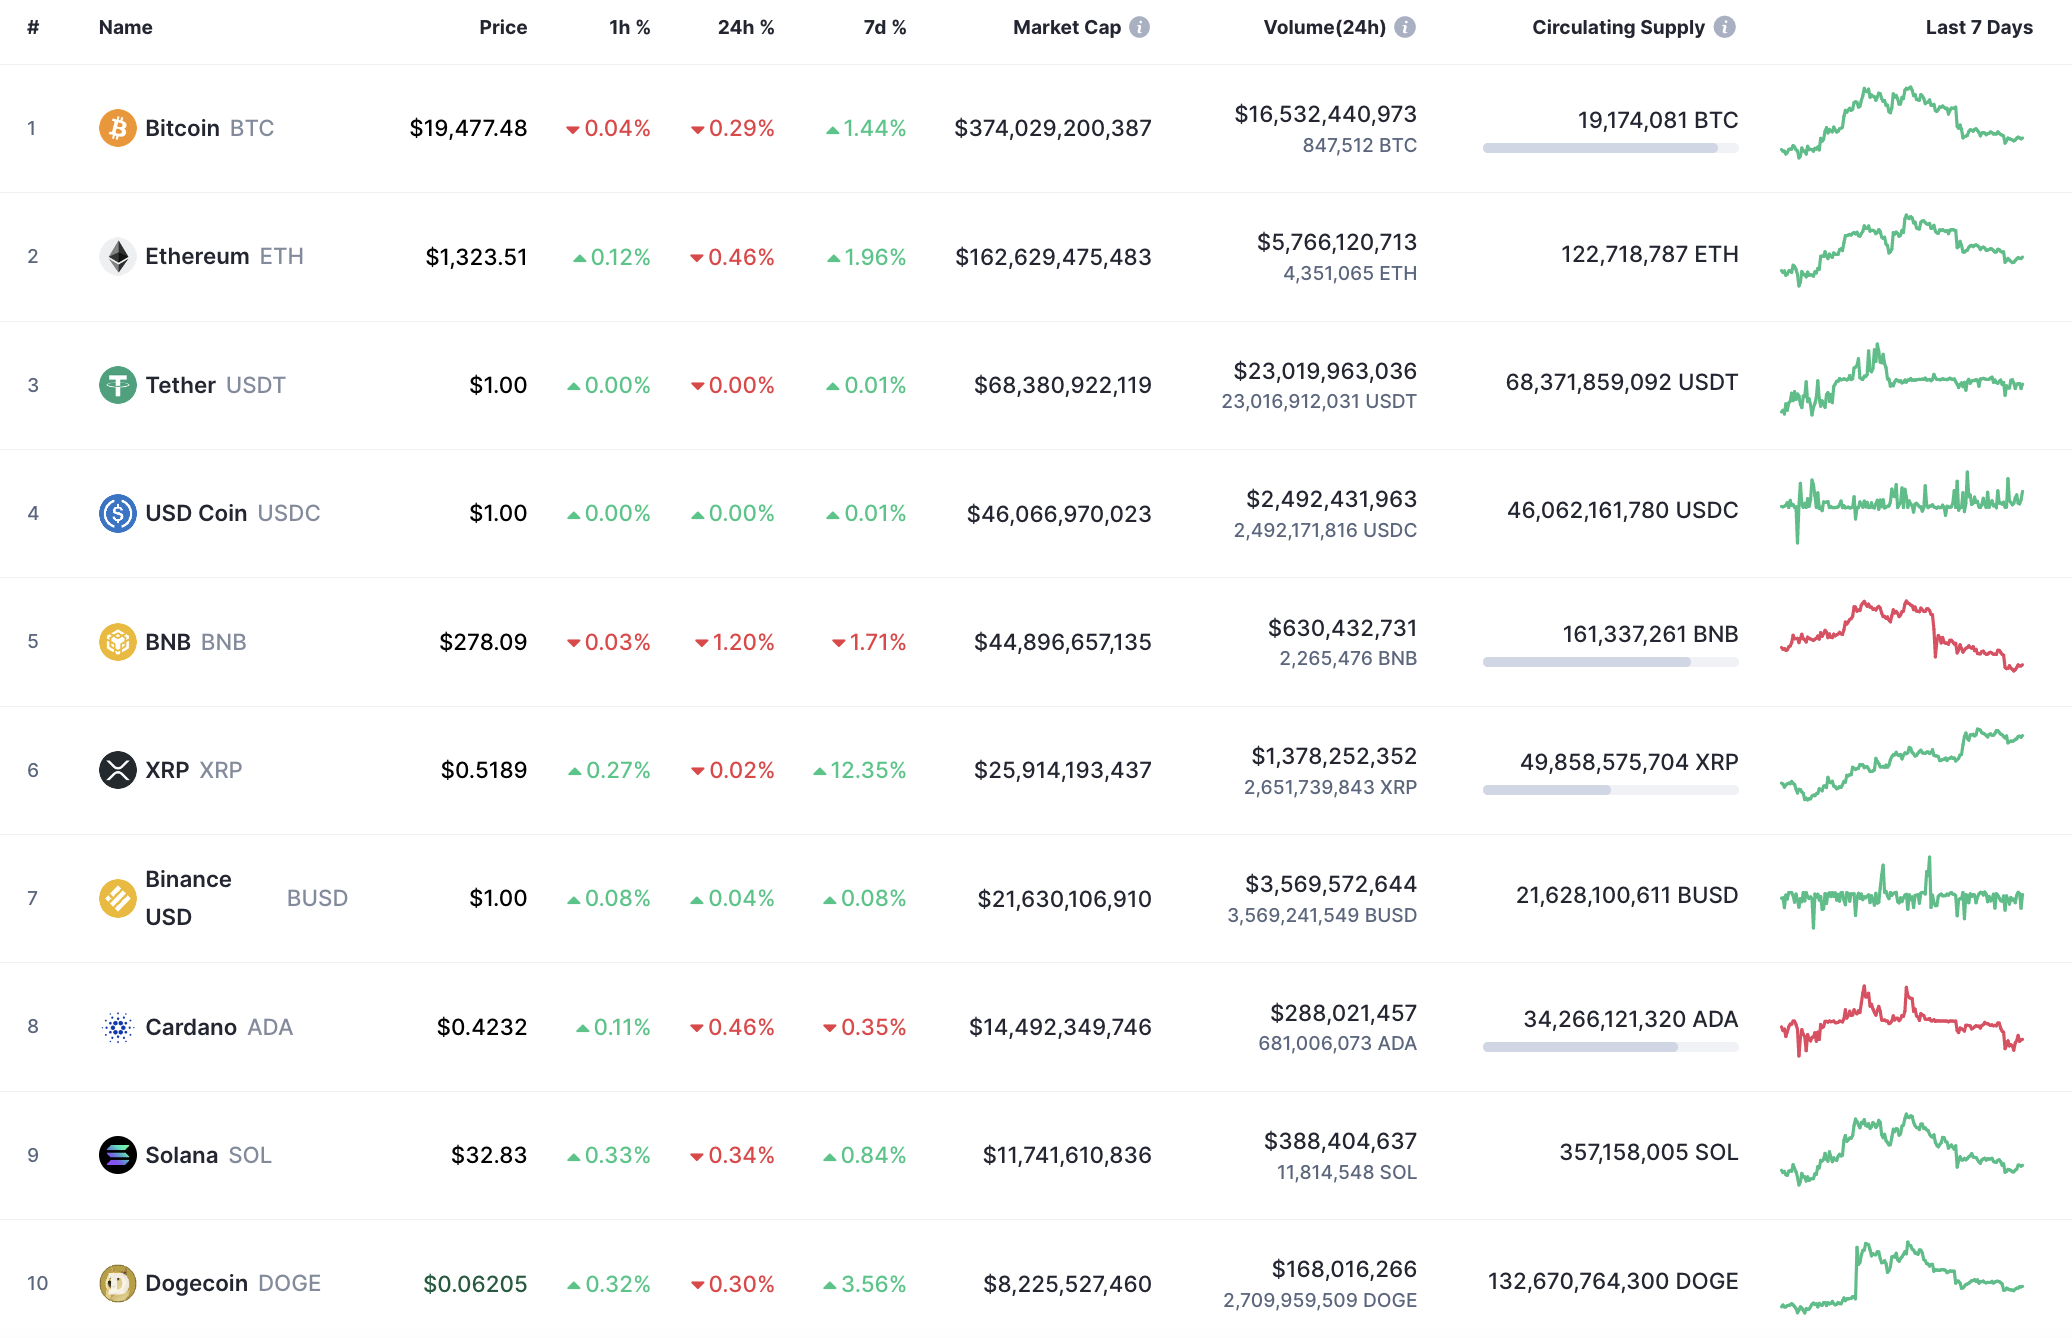
Bears continue their pressure as most of the coins remain in the red zone.
BTC/USD
The rate of Bitcoin (BTC) has declined by 0.29% since yesterday, while the price has risen by 1.46% over the last week.
BTC/USD chart by TradingView" src="https://cnews24.ru/uploads/6dd/6ddc89e7502751d074cd0ff5e02ff8e275cb18ab.png" size="2708x1320">
On the hourly chart, Bitcoin (BTC) has begun to rise after the false breakout of the support level at $19,331. At the moment, the price is near the local resistance at $19,524.
If buyers can hold the gained initiative, the rise may continue to the $19,600 zone.
BTC/USD chart by TradingView" src="https://cnews24.ru/uploads/e42/e4214f72bb973117d6c51339ae0f665b654be54b.png" size="2708x1320">
On the bigger time frame, Bitcoin (BTC) has once again bounced off the support level at $19,335. While the price is above it, there is a chance for local growth. If that happens, the next zone where sellers can return to the game is the area of $19,800.
BTC/USD chart by TradingView" src="https://cnews24.ru/uploads/9a2/9a298f5ad7b8dda977c4e17c219d5f4cad155594.png" size="2708x1320">
From the midterm point of view, the situation is more bearish than bullish as the price is still near the support level of $17,592. If buyers lose the $19,000 mark, one can expect a sharp drop soon.
Bitcoin is trading at $19,503 at press time.