The leading cryptocurrency, Bitcoin, suffered a massive drop, losing more than 12% to $19,850 amid stronger-than-expected US CPI figures. Before the news release, technical indicators, particularly the 100-day moving average (MA), indicated the possibility of a bullish trend continuation. However, the BTC/USD has fallen below the moving average, resulting in a significant drop.
In this update, I will discuss the fundamentals that drove a sharp sell-off in Bitcoin and the technical outlook that suggests Bitcoin may be about to pump if the signal is right.
US Inflation at 8.3% in August
The Bureau of Labor Statistics released one of the most anticipated data sets, the Consumer Price Index (CPI) and Core CPI, during the US session. Both figures outperformed the previous month's release, fueling a strong rise in dollar demand.
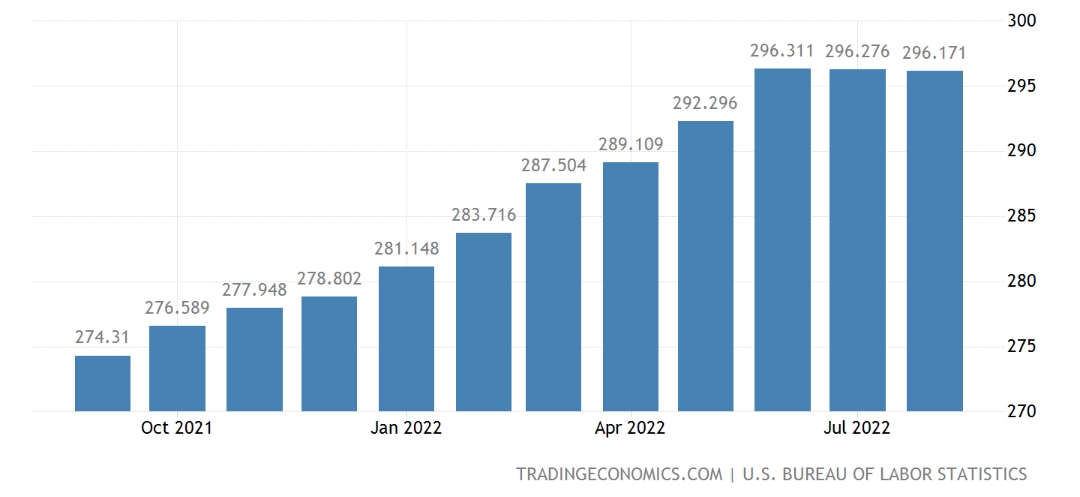
Consumer prices rose 0.1% month on month, following a flat reading in July and falling short of a 0.1% reduction estimate. The US CPI index was 296.17 points in August, compared to 296.28 points the previous month and 295.53 points expected by the market.

The annual inflation rate in the United States fell for the second month in a row to 8.3% in August 2022, the lowest in four months, from 8.5% in July. However, it's still above market expectations of 8.1%.
What Effect Does a Higher Inflation Rate Have on Cryptocurrencies?
To understand this, we first need to understand what inflation is. It reflects a change in the price of consumer goods and services. So a higher inflation rate signifies solid economic growth. However, if the CPI figures cross the Fed's inflation target levels, it becomes hyperinflation, which isn't considered suitable for the economy.
The US government has mandated a 2% inflation target to maintain price stability. The results are beneficial for long-term preparations. However, when inflation is significant or fluctuates frequently, it becomes difficult for companies and consumers to predict costs accurately.
The Fed's 2% Inflation Target
The Federal Reserve's policymaking Federal Open Market Committee has had a 2% annual inflation target "as assessed by the yearly change in the price index for personal consumption expenditures" (PCE) since January 2012.
According to a recent IMF report:
The economy is expected to slow, as the Federal Reserve (the Fed) continues to tighten monetary policy and COVID economic relief programs come to an end, bringing core Personal Consumption Expenditure (PCE) inflation down to the Fed’s 2 percent medium-term target by late 2023
The Fed's medium-term target for inflation is 2%, while the current inflation rate is above 8%. So, to control this, the Federal Reserve may have to go for another round of rate hikes.
BTC Under Pressure as another Big Rate Hike Expected
The high CPI figures ensure that on Wednesday of next week, when the US Federal Reserve announces its next policy decision, the Fed fund rate has a strong prospect of being raised by three-quarters of one percent.
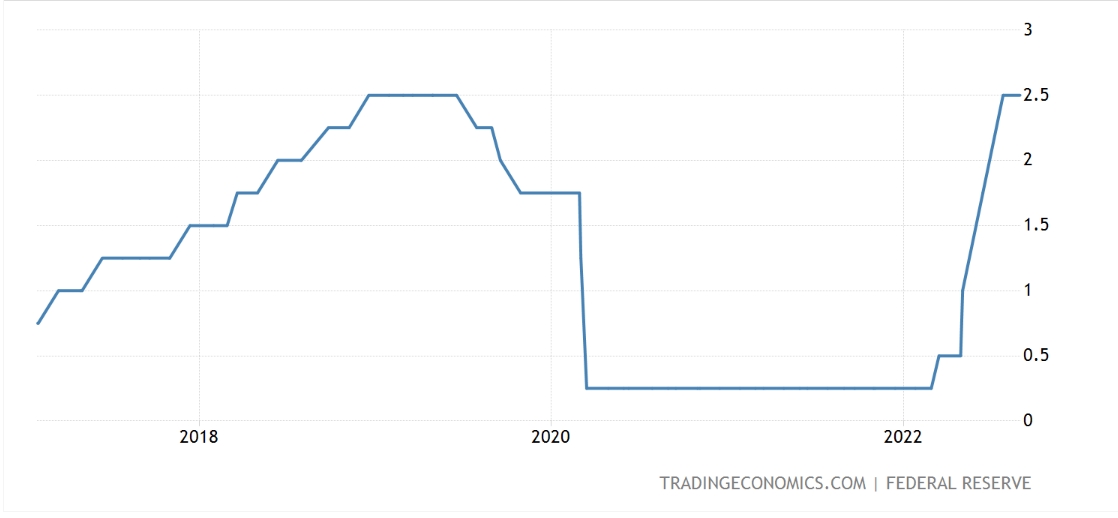
The Federal Reserve raised its key policy rate from 1.5%-1.7% last month to 2.25%-2.5%, and the market is now pricing in a further increase to 3%-3.25%. At the beginning of the year, the Fed Funds rate was between 0% and 0.25%. If the rate is increased again next week, it will be the third straight increase to the 3%-3.25% level.

The markets have been anticipating such a hike since Fed chairman Jay Powell's speech at the end of August to a symposium of central bankers at Jackson Hole in Wyoming, in which he said the Fed would be prepared to risk a US recession if that was the price to be paid for bringing US inflation under control.
Rate Hikes Kick in Risk-off Sentiment
Higher interest rates cause a "risk-off" reaction, in which investors shift their investments away from risky securities such as stocks, indices, and cryptocurrencies and toward safe-haven assets for a risk-free return.
These risk-free securities include government bonds, interest on saving accounts, T-bills, and repurchase agreements. As a result, the Bitcoin price fell sharply following the release of the CPI figures.
Enough said about fundamentals; let us now look at Bitcoin's technical outlook.
Why Bitcoin Could Be About to Pump if This Signal is Right
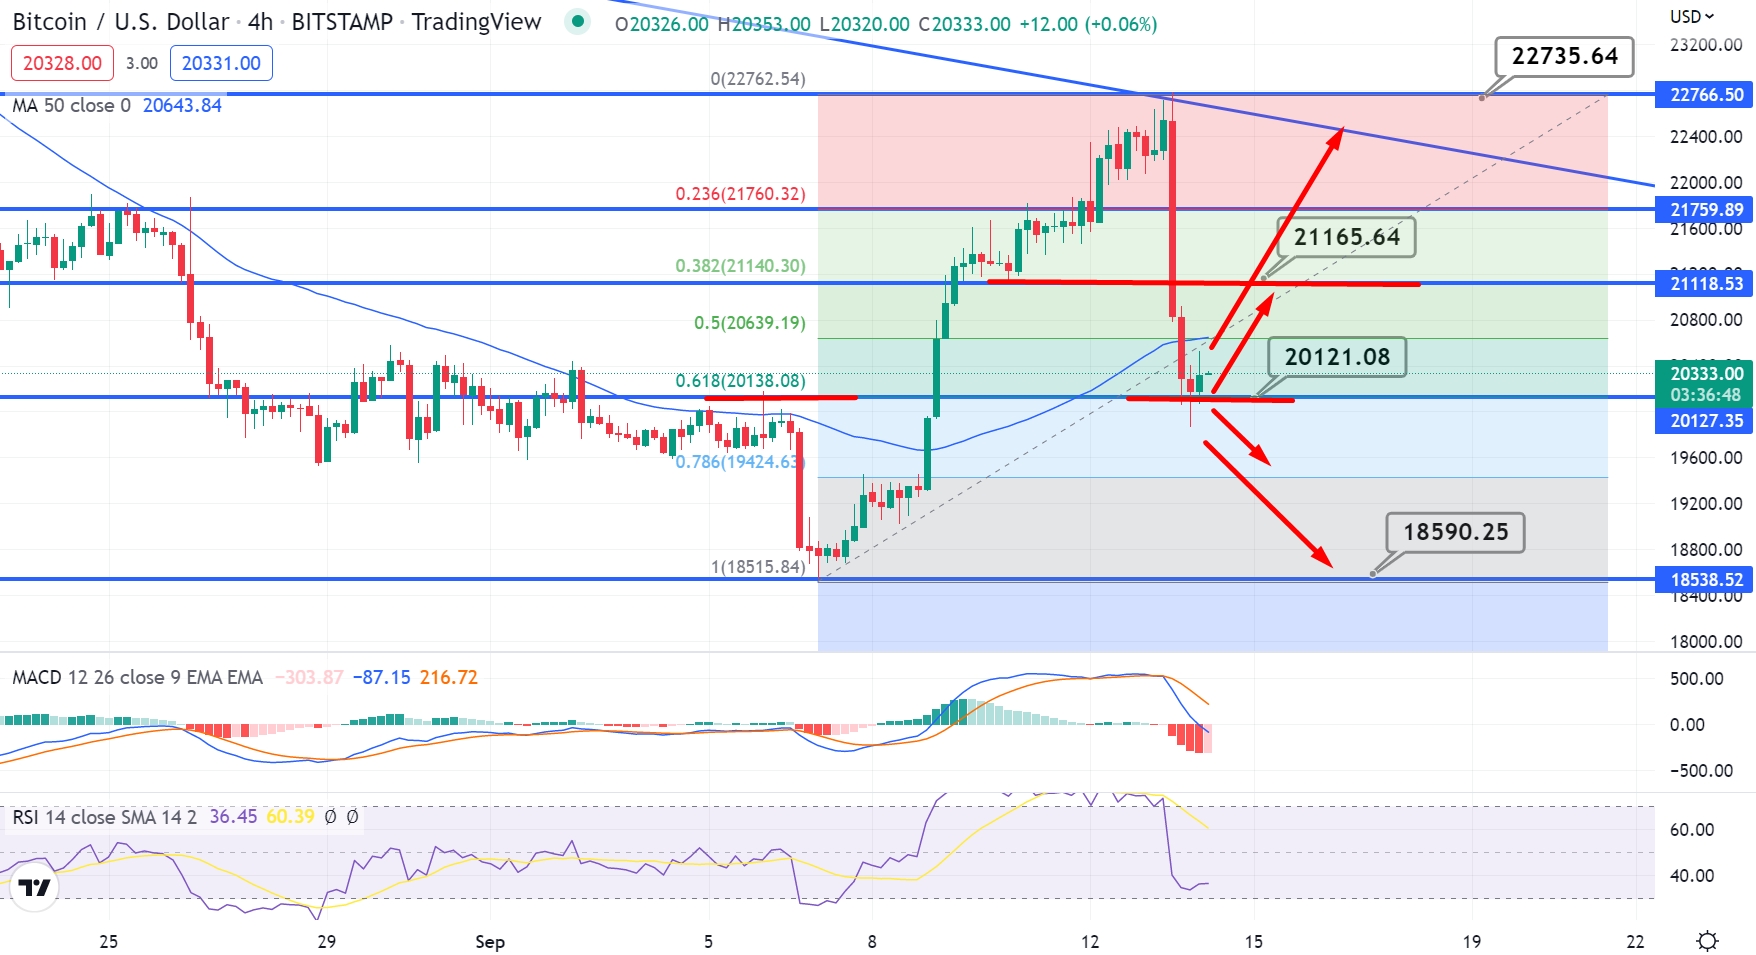
The Bitcoin price fell so sharply after the release of US CPI figures that it entered the oversold zone. The BTC/USD pair is currently trading at $20,331, with immediate support at $20,108.

On the 4-hour timeframe, the BTC/USD pair has completed a 61.8% Fibonacci retracement at $20,108 and has formed a candlestick pattern known as a "hammer," which indicates that sellers are exhausted, and bulls may take control soon. It typically weakens the bearish trend and initiates a bullish reversal.
Simultaneously, leading technical indicators such as the relative strength index (RSI) and moving average convergence divergence (MACD) have entered the oversold territory. Both indicators increase the likelihood of a bullish bounce above the 61.8% Fibonacci retracement level.
The 50-day moving average, on the other hand, indicates the inverse. It is extending significant resistance at the $20,650 level. Increased Bitcoin demand could cut through the 50 MA, allowing for more buying until the $21,165 or 22,735 resistance levels.
Alternatively, a bearish breakout of the $20,108 support zone could prolong the selling trend until the next support level of $19,424 or $18,515. Let's keep an eye on $20,108 to determine further price action in Bitcoin.
 cryptonews.com