The latest Chainlink price analysis shows a massive bullish trend after the bulls reclaimed above the $7.00 level. Resistance for the coin is present at $7.76, However, a break above this level is expected to push the coin towards the $8 levels and $8.50 levels in the near term. On the downside, support is present at $7.21 and a break below this level might result in a sell-off towards the $6.50 and $6 levels.
Chainlink analysis is trading at $7.74 at press time and is up by over 4.36 percent in the last 24 hours as the digital asset has a market capitalization of over $3.6 billion while the 24-hour trading volume is just over $359 million. Chainlink price analysis shows that the bulls have regained the $7.74 level and are now targeting a move towards the $8 level in the near term. The digital asset is likely to see some consolidation at the current levels before it can make a move towards the said target.
LINK/USD 1-day price chart: Bullish momentum recovers price up to $7.74
The 1-day, Chainlink price analysis reveals the market’s volatility as the price fluctuates between the $7.21and $7.76 trading range. Earlier, a downward wave suppressed the price, but the bulls managed to push it up as the price found support near $7.21.
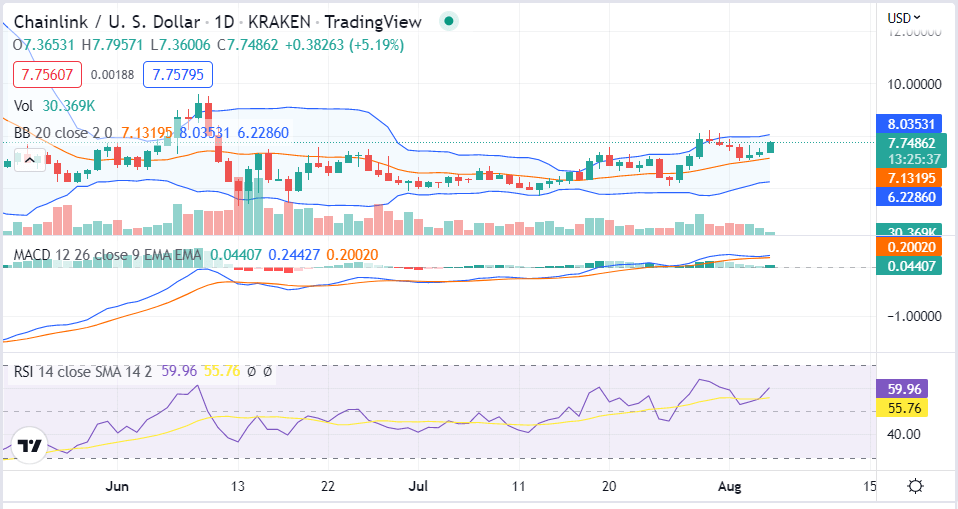 LINK/USD 1-day price chart, source: Tradingview
The MACD shows increasing bullish momentum as the signal line crosses above the MACD line. The upper limit of the Bollinger Bands on the said timeframe has expanded, which suggests that the market is due for a consolidation phase soon while the lower limit of the Bollinger Bands is close to the $6.73 support level. The RSI indicator is well above the 50-level, which confirms the bullish momentum in the market.
Chainlink price analysis: Recent developments and further technical indications
The 4-hour, Chainlink price analysis shows that the price is following an ascending channel formation as it makes higher highs and higher lows. The digital asset is trading well above the $7.21 support level and is currently facing resistance near the $7.76 level. The bears might make one more attempt to push the price down, but the $7.21 support level is likely to provide strong buying interest in the market.
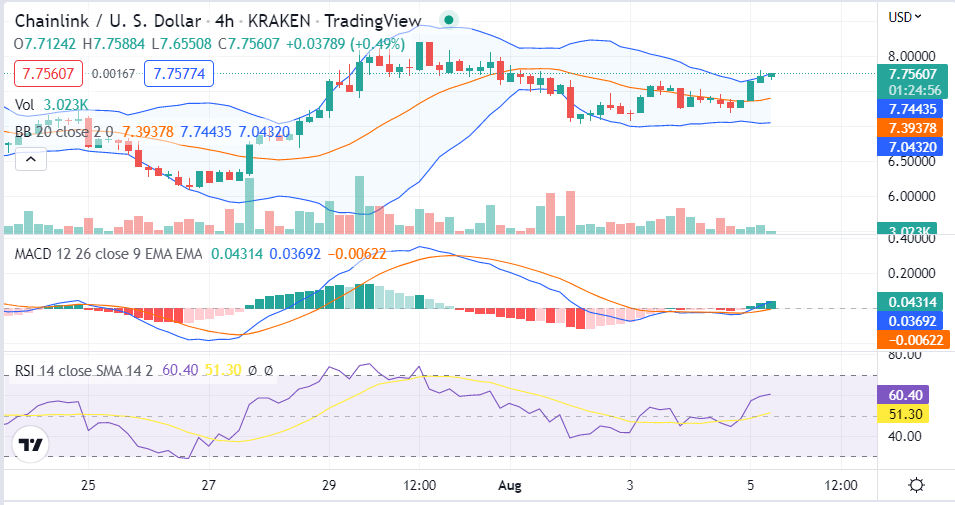 LINK/USD 4-hour price chart, source: Tradingview
The volatility is also increasing, which is an encouraging sign for the buyers regarding the upcoming price trends. Similarly, the upper edge and the lower edge of the Bollinger bands are moving apart, which suggests that the market is due for a consolidation phase soon. The MACD on the said timeframe is also close to crossing above the signal line, which would confirm a bullish trend in the market. The RSI indicator is currently at 63.64 and is well above the 50-level, which suggests that the market has enough room to move higher in the near future.
Chainlink Price Analysis Conclusion
Chainlink price analysis reveals the cryptocurrency to follow a strong upwards trend with much more room for bullish activity. The bulls have currently taken over the market, and the declining volatility favors the bulls, and they might be able to raise the price of LINK significantly and aim for the $8 level in the near term.
Disclaimer. The information provided is not trading advice. Cryptopolitan.com holds no liability for any investments made based on the information provided on this page. We strongly recommend independent research and/or consultation with a qualified professional before making any investment decisions.