- Cosmos (ATOM) price is forming a high-low formation in the context of the daily price chart.
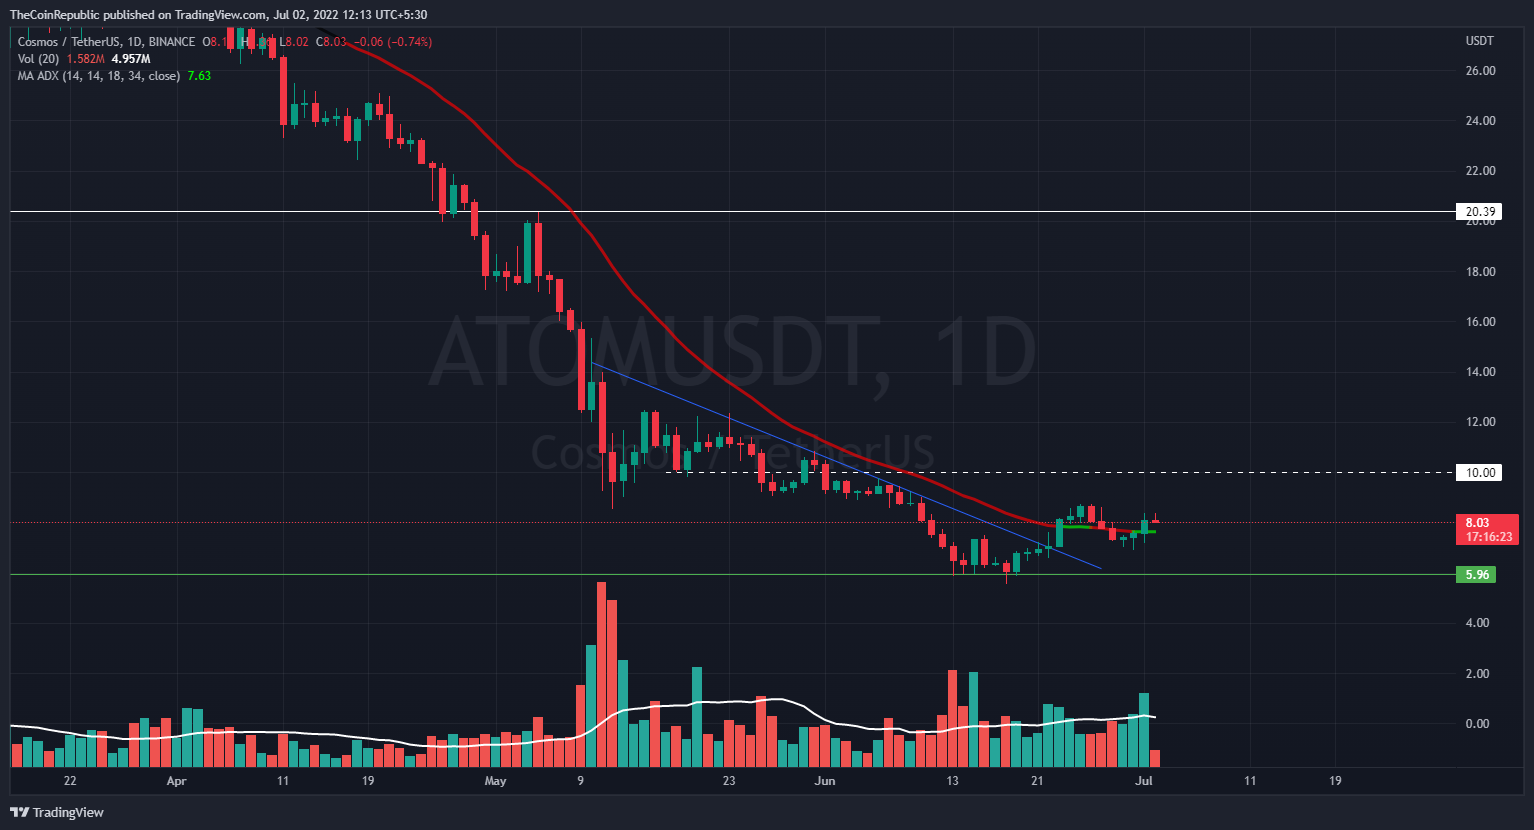
- As ATOM cost remains above the green moving zone of the MA ADX indicator on the daily price chart.
- The bitcoin pair with Cosmos Coin is trading at 0.0004165 satoshis while up 9% in the green zone.
Cosmos (ATOM) has now crossed above a downward sloping trend line that served as a bear defense zone prior to the 45-day breakout. ATOM investors face a retracement phase throughout a bullish trend, but the price movement remains to form higher lows on the daily price graph.
ATOM’s price has recently recovered from its 10-day low. As a result, the ATOM coin is currently trading at $8. However, the bulls will have to face the retracement phase once more during the intraday trading session..
Weekly price action takes place inside the previous bearish candles. At this point, further price prediction is quite difficult unless the price breaks the high or low of the previous weekly price candle.
The market cap of Cosmos (ATOM) coin reached above $2.2 billion according to CMC data, an increase of 8% in the last 24 hours. Amidst pump and dump, the price of ATOM pairs with bitcoin pair traders at 0.000417 Satoshis, giving support to the bulls by 9.1%.
Buying opportunities turned into a bullish opportunity as ATOM cost remains above the green moving zone of the MA ADX indicator on the daily price chart. By trading volume, bulls are buying ATOM coins.
Bears failed to dump ATOM price below 20 DMA
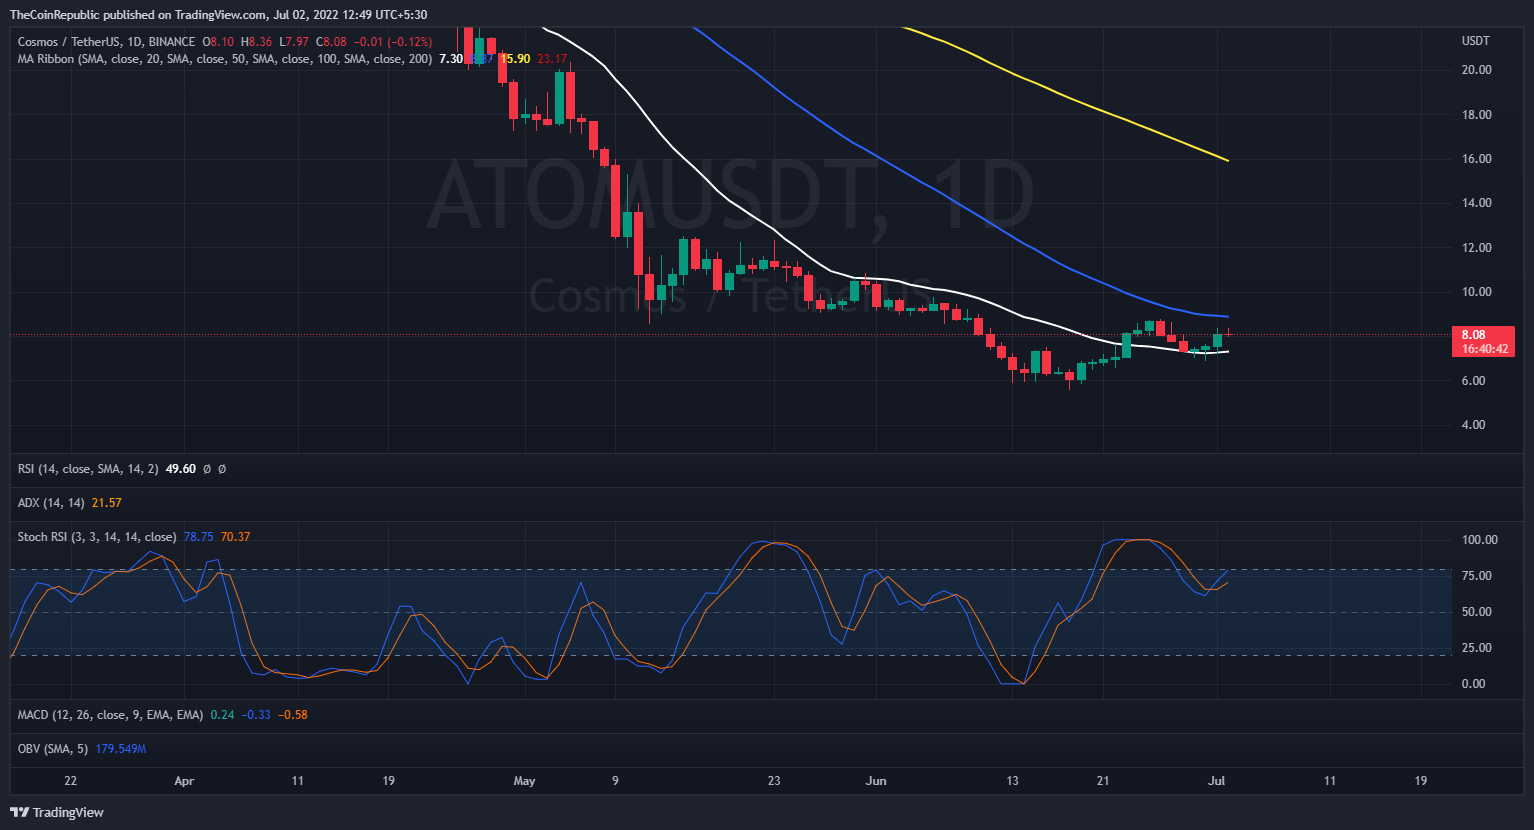
On the daily price scale, the 20-day EMA is acting as a short-term support level for the ATOM bulls. Meanwhile, the bulls struggle near the 50 DMA (Blue).
Besides, the daily Stoch RSI indicator moved above the semi-line and again to the overbought zone.
Conclusion
Cosmos (ATOM) is trapped below the 20-day SMA or the 50-day SMA. Buyers may see a slight downside near the $10 round level if the price moves above the 50 EMA.
Support level – $6.0 and $5.0
Resistance level – $10 and $15
Disclaimer
The views and opinions stated by the author, or any people named in this article, are for informational ideas only, and they do not establish the financial, investment, or other advice. Investing in or trading crypto assets comes with a risk of financial loss.
ALSO READ: Shark Tank Star Says Cryptocurrencies haven’t Reached Their Lowest Yet: Applications Are The Only Solutions For Bear Market