High momentum breakout from a double bottom pattern neckline at $4.57, may soar UNI price by 80%, but is it safe to enter a bear market?
Key technical points:
- The UNI market price has appreciated 40% over the past five days.
- The price action breached the 20-day EMA dynamic resistance.
- The 24-hour trading volume of Uniswap is $260.1 Million, indicating a hike of 61%.
Past Performance of UNI
On June 11th, a five-week-old range setup ended on a bearish note, as UNI price breached the $4.56 support. The post-retest downfall deprecated the altcoin by 26% and plunged it to a new 2022 low of $3.37. However, technical chart several lower price rejection candles at the mentioned low, validating it as legitimate support. 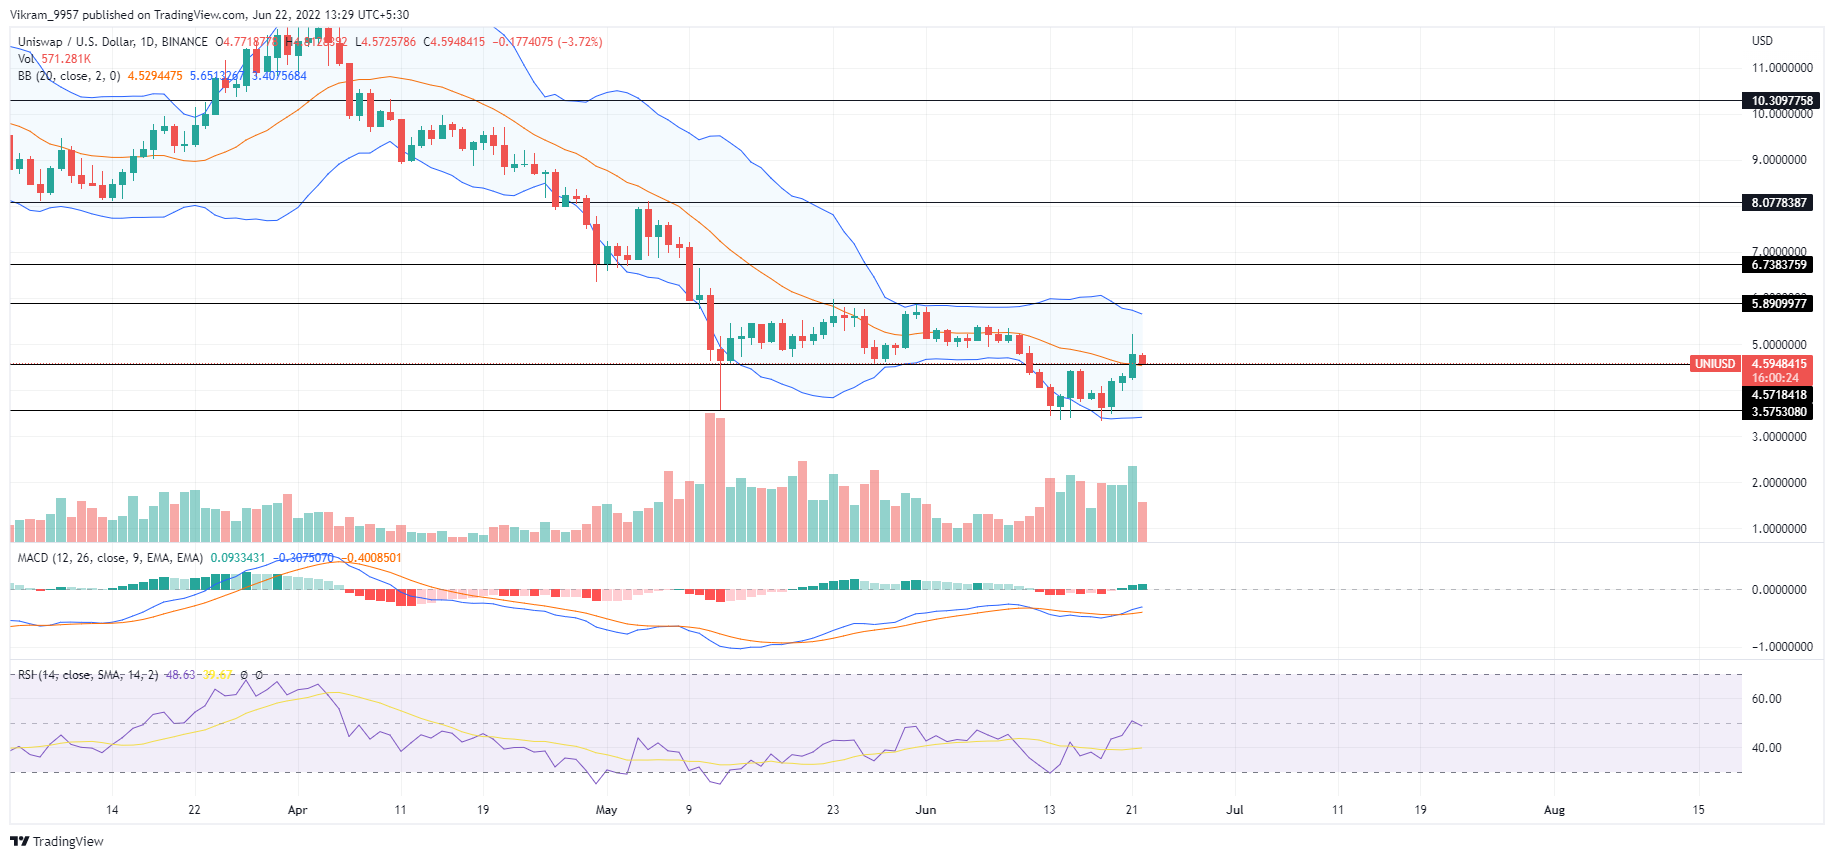 Source- Tradingview
UNI Technical Analysis
Last week the UNI/USDT pair wavered above the new support of $3.37 and shaped into a double bottom pattern. Then, on June 21st, the coin buyers gave a decisive breakout from the $4.65 neckline, reflecting a recovery opportunity. MACD indicator: The bullish crossover between the fast and slow lines bolsters the reversal pattern breakout. Moreover, the histogram chart shows a steady rise of green bars, accentuating growth in underlying bullishness. Bollinger Bands: Since April, the UNI price majorly traded below the midline of the Bollinger band indicator. However, with the recent price jump, the buyers have reclaimed resistance accentuating the improved sentiment among market participants. RSI indicator: Following a bullish divergence, the daily-RSI slope climbed straight to the overhead midline. A potential crossover above the 50% mark would offer additional confirmation for long traders. In a nutshell, the UNI technical analysis suggests a recovery opportunity if coin buyers complete the double bottom pattern.
Upcoming Trend
Today, the UNI price is down 3% and retests the breached resistance of $4.65. However, if bullish momentum persists, the altcoin may rise 80% to $8.28. On a contrary note, the long-wick attached to the breakout candle suggests the sellers are still wrestling with sustaining their trend control. Thus, a possible fakeout could slump the coin price back to $3.37. Resistance Levels: $5.73 and $6.63 Support Levels: $3.37 and $3