Solana price analysis is bullish as firm support is seen at the $38.44 level and resistance is faced at the $44.45 level. Prices have breached above the descending triangle pattern and are currently retesting the breakout point. However, if prices can break above this level, they could test higher levels such as $50.00. The altcoin has seen some strong buying pressure as of late and looks poised to continue its upward momentum in the medium term. Solana prices have been hovering around the $40.00 level for the past few days, however, they have managed to break out to the upside and are currently trading at $44.25.
The digital asset has seen some strong buying pressure as of late and looks poised to continue its upward momentum in the medium term. SOL has been one of the best-performing altcoins in the past 24 hours, with prices rising by more than 10 percent. The digital asset is currently trading at $44.25, which is close to its all-time high of $44.45.
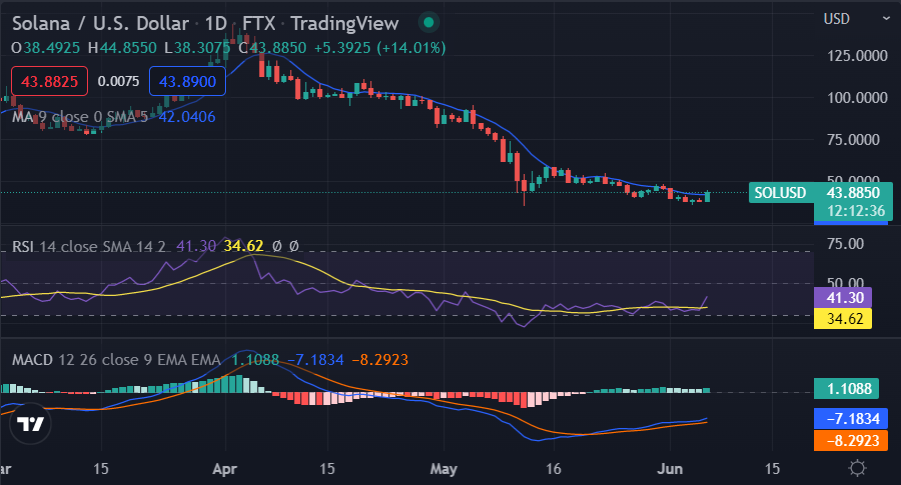
Solana price action on a 1-day price chart: SOL/USD trades above $44.25
One day Solana price analysis shows that the coin has been on a tear in the past 24-hours, with prices rising from $38.44 to $44.25. The trading volume of the digital asset has also increased significantly in the past 24 hours, which is a sign that the bulls are in control of the market as it is currently sitting at $1,544,538,149 and a market cap of $15,059,242,073.

The technical indicators are also giving off bullish signals as the RSI is currently trading at 65.62 and is above the 50 level, which is a sign that the bulls are in control of the market. The MACD is also trading in the positive territory and is currently gaining momentum. The MA 50 is also trending upwards, which is a sign that the bulls are in control of the market.
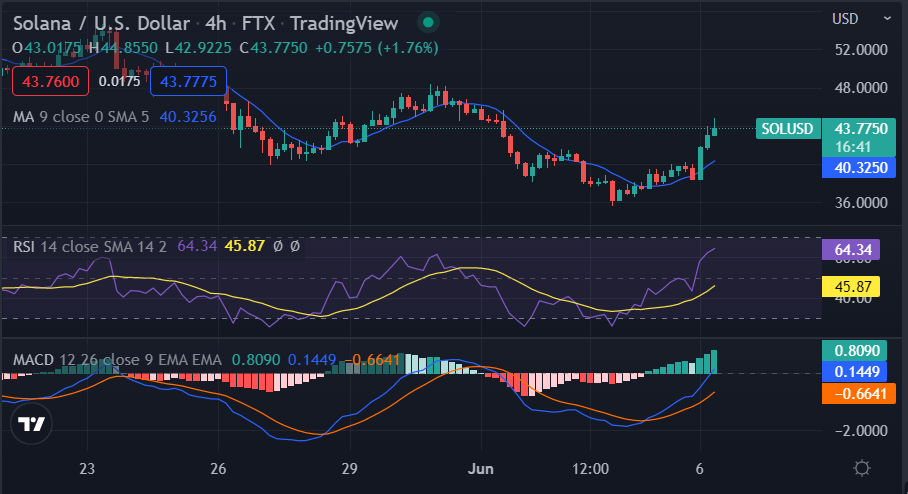
Solana price analysis on a 4-hour price chart: Bulls have won the race after a short-term price battle
On the 4-hour price chart, Solana’s price analysis reveals that the coin had started to recover after the previous loss. The SOL/USD is currently trading at $44.25 and is facing immediate resistance at $44.45 and support for SOL/USD is present at $38.44. Bears tried to take control after the initial breakout but the bulls had other plans. The market looks overbought on the 4-hour time frame as the RSI is currently trading at 79.04 and is well above the 70 levels. The MACD has also started to lose momentum and is currently trading in the positive territory. The Moving average of 50 is trending upwards, which is a sign that the bulls are in control of the market.

Solana price analysis conclusion
Solana price analysis shows that the coin has seen a strong rally in recent days and looks poised to continue its uptrend in the near term. Prices have found some support around the $38.44 level, which could provide some stability in the event of a pullback. The bulls are currently in control of the market as prices have been trading above the moving averages. However, investors should exercise caution as prices may correct lower in the event of a sudden sell-off.
Disclaimer. The information provided is not trading advice. Cryptopolitan.com holds no liability for any investments made based on the information provided on this page. We strongly recommend independent research and/or consultation with a qualified professional before making any investment decisions
 cryptopolitan.com