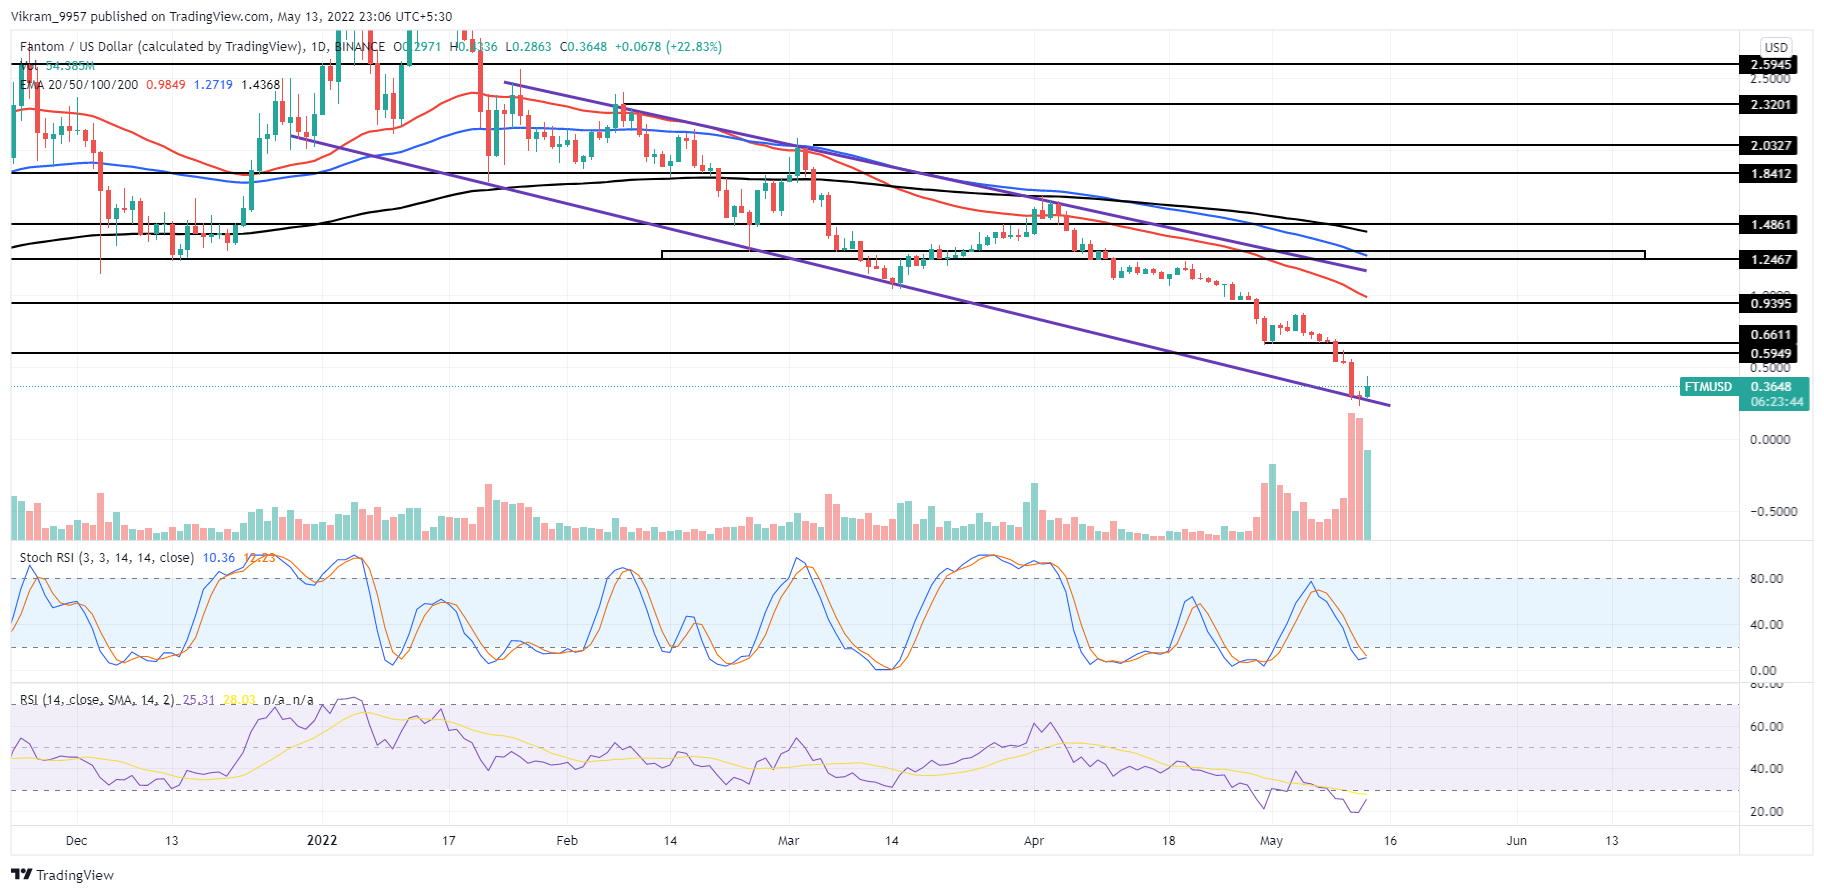
With a morning star pattern, FTM buyers overtake the trend control within the descending channel. Will the reversal outgrow the bearish channel? Key technical points:
- The FTM prices have grown by 20% in the last 24 hours.
- The RSI slope surpasses the 14-day average.
- The 24-hour trading volume of Fantom is $647 Million, indicating a 6% hike.
Past Performance of FTM
FTM prices remain under tremendous bearish pressure as the downtrend continues in a falling channel pattern, accounting for an 87% fall. The recent downfall takes support at the descending trendline and forms a morning star pattern, a reversal pattern accounting for a 20% jump.  Source-Tradingview
FTM Technical Analysis
FTM price action shows bullish commitment evidenced by the increased trading volume, but the bullish follow-through faces formidable selling pressure close to $0.44. This results in a higher price rejection and lowers the chances of an upside continuation. The crucial daily EMAs maintain a bearish alignment and continue to descend lower, reflecting a high-momentum correction phase in motion. The RSI slope shows a bullish reversal within the oversold boundary but struggles to exit it. However, the indicator shows a substantial bullish divergence in the last two dips displaying a high trend reversal possibility. The Stochastic RSI displays a high possibility of a bullish crossover as the K line prepares to cross above the D line inside the oversold zone. Hence, the lines might shortly announce the start of a new bull run. Thus, the momentum indicators suggest a high likelihood of an uptrend but lack commitment due to decreased trading volume. In short, the FTM technical analysis forecasts an uptrend continuation to the $0.50 mark.
Upcoming Trend
Considering the morning star pattern completes and pushes the FTM prices higher, a potential halt at $0.50 will start a new power struggle. A bullish breakout will result in a price jump to the psychological mark of $1, but a reversal will fuel a correction fall to the $0.20 mark. Support Levels: $0.20 and $0.15 Resistance Levels: $0.50 and $0.75
 cryptoknowmics.com