Polkadot ($DOT) Price Analysis
$DOT price analysis on April 17 2022 is explained below with a two hour time frame.
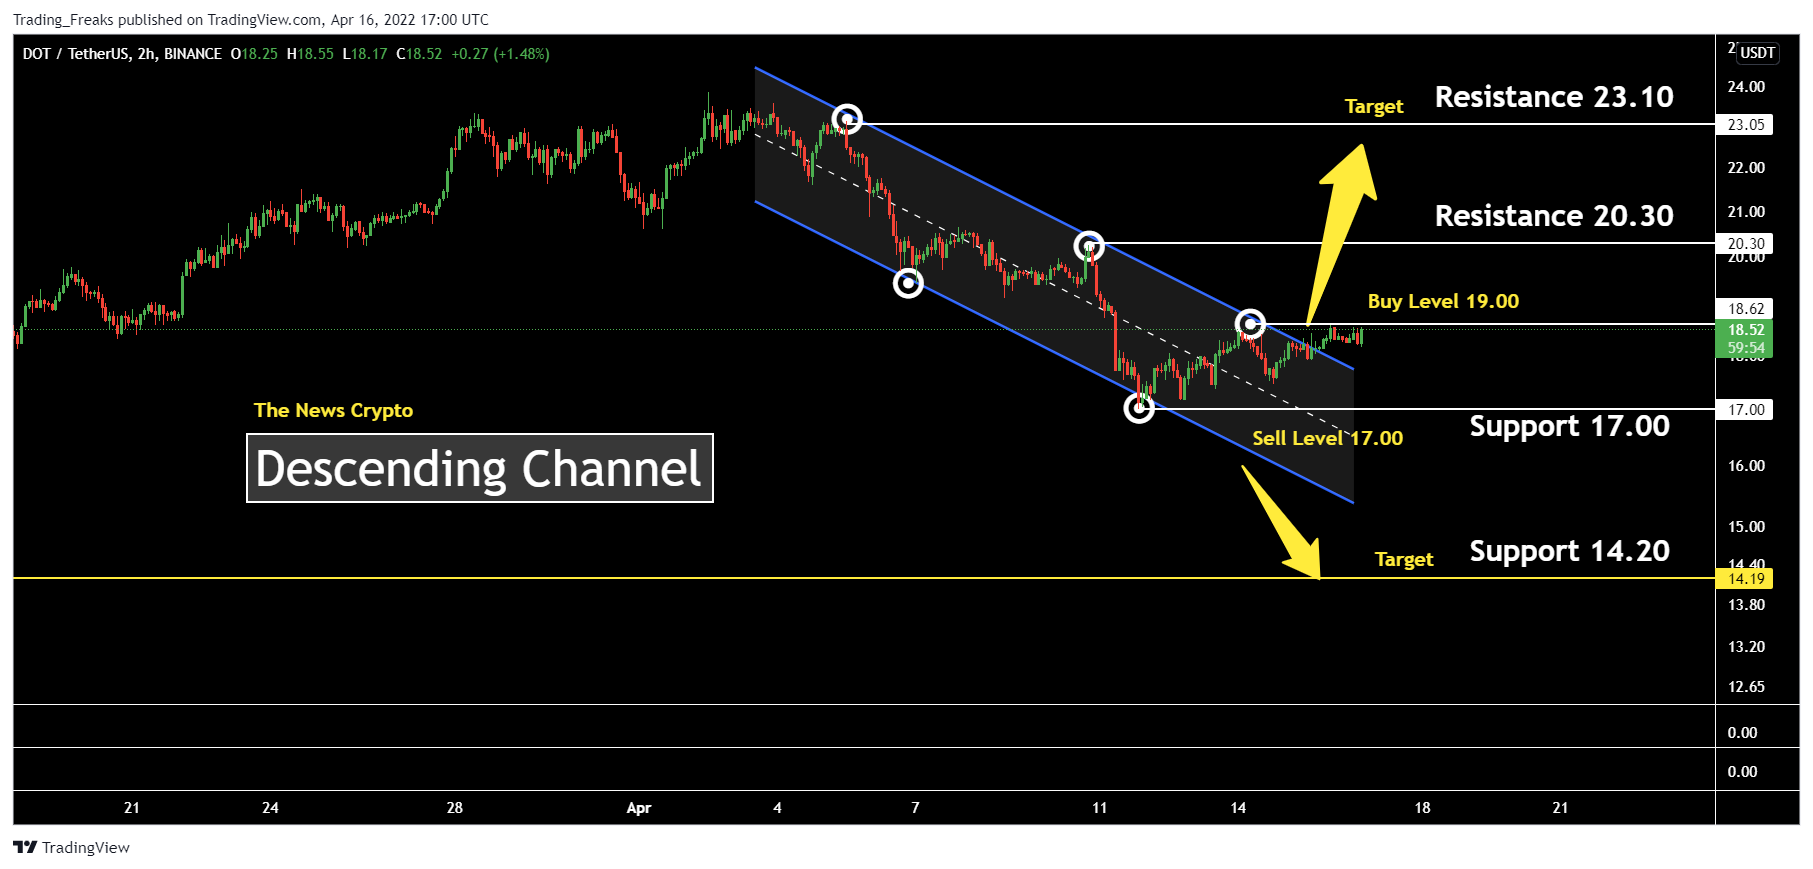
$DOT/USDT Descending Channel Pattern (Source: Tradingview)
A descending channel is a chart pattern formed from two downward trendlines drawn above and below a price representing resistance and support levels. The descending channel pattern is also known as a falling channel or channel down. The upper line is identified first, as running along with the highs and is called the trendline.
When the price is around the upper trend line, look for short opportunities, although aggressive traders could trade long and short at both trend lines looking for a bounce or pullback. Another way to trade this pattern is to wait for the price to break through either trendline. Descending channels, like ascending channels, are a tool for determining whether the trend in price will continue.
Currently, the price of $DOT is $18.57. If the pattern continues, the price of $DOT might reach the resistance level of $20.30, $23.10 and the buy level of $DOT is $19. If the trend reverses, then the price of $DOT may fall to $14.20 and the sell level of $DOT is $17.
Polkadot ($DOT) Moving Average
The $DOT’s Moving Average (MA) is shown in the chart below.
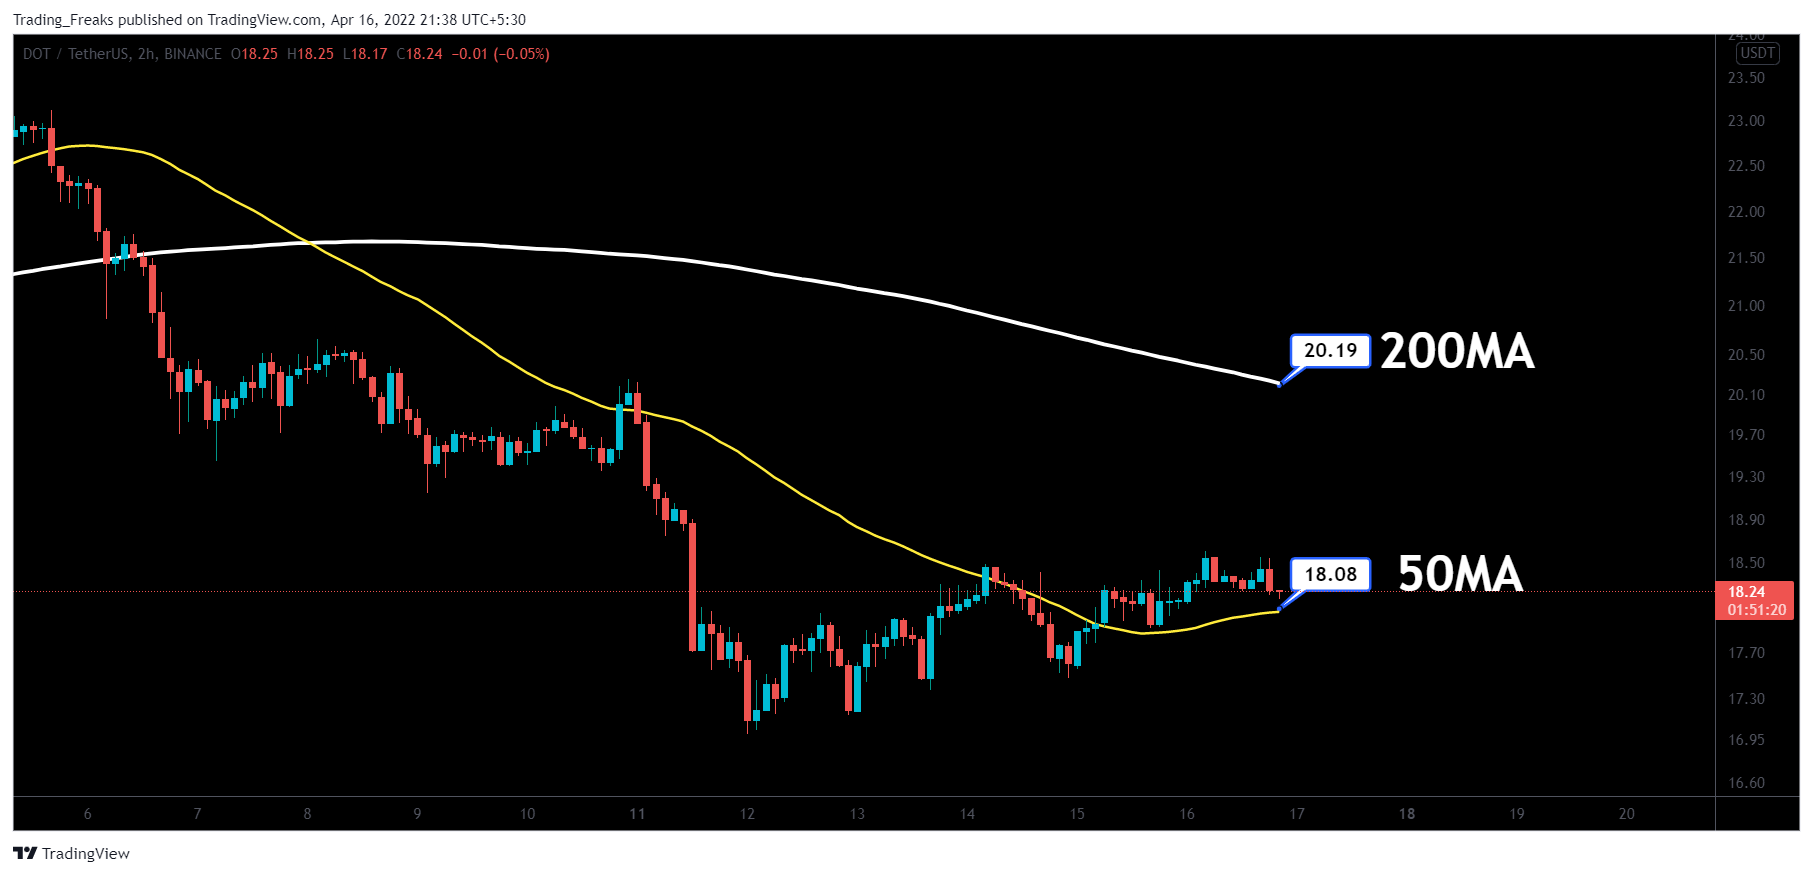
$DOT MA (Source: Tradingview)
The $DOT price lies above 50MA (short-term) and the price lies below 200MA (long-term), so based on the 50MA it is in an upward trend and based on the 200MA it is in downward trend. Therefore, there is a possibility of a reversal trend of $DOT at any time.
Disclaimer: The opinion expressed in this chart solely author’s. It does not interpreted as investment advice. TheNewsCrypto team encourages all to do their own research before investing.

 thenewscrypto.com