Past Performance of $ICP
$ICP coin price reached the 100-day EMA with the 42% rally starting from the $15.50 mark and breaking above the $20 mark. However, the sellers-driven EMAs rejected the bullish rally twice, resulting in a double top pattern. Today, the prices fall below the neckline at $21 and approach the $19 mark. 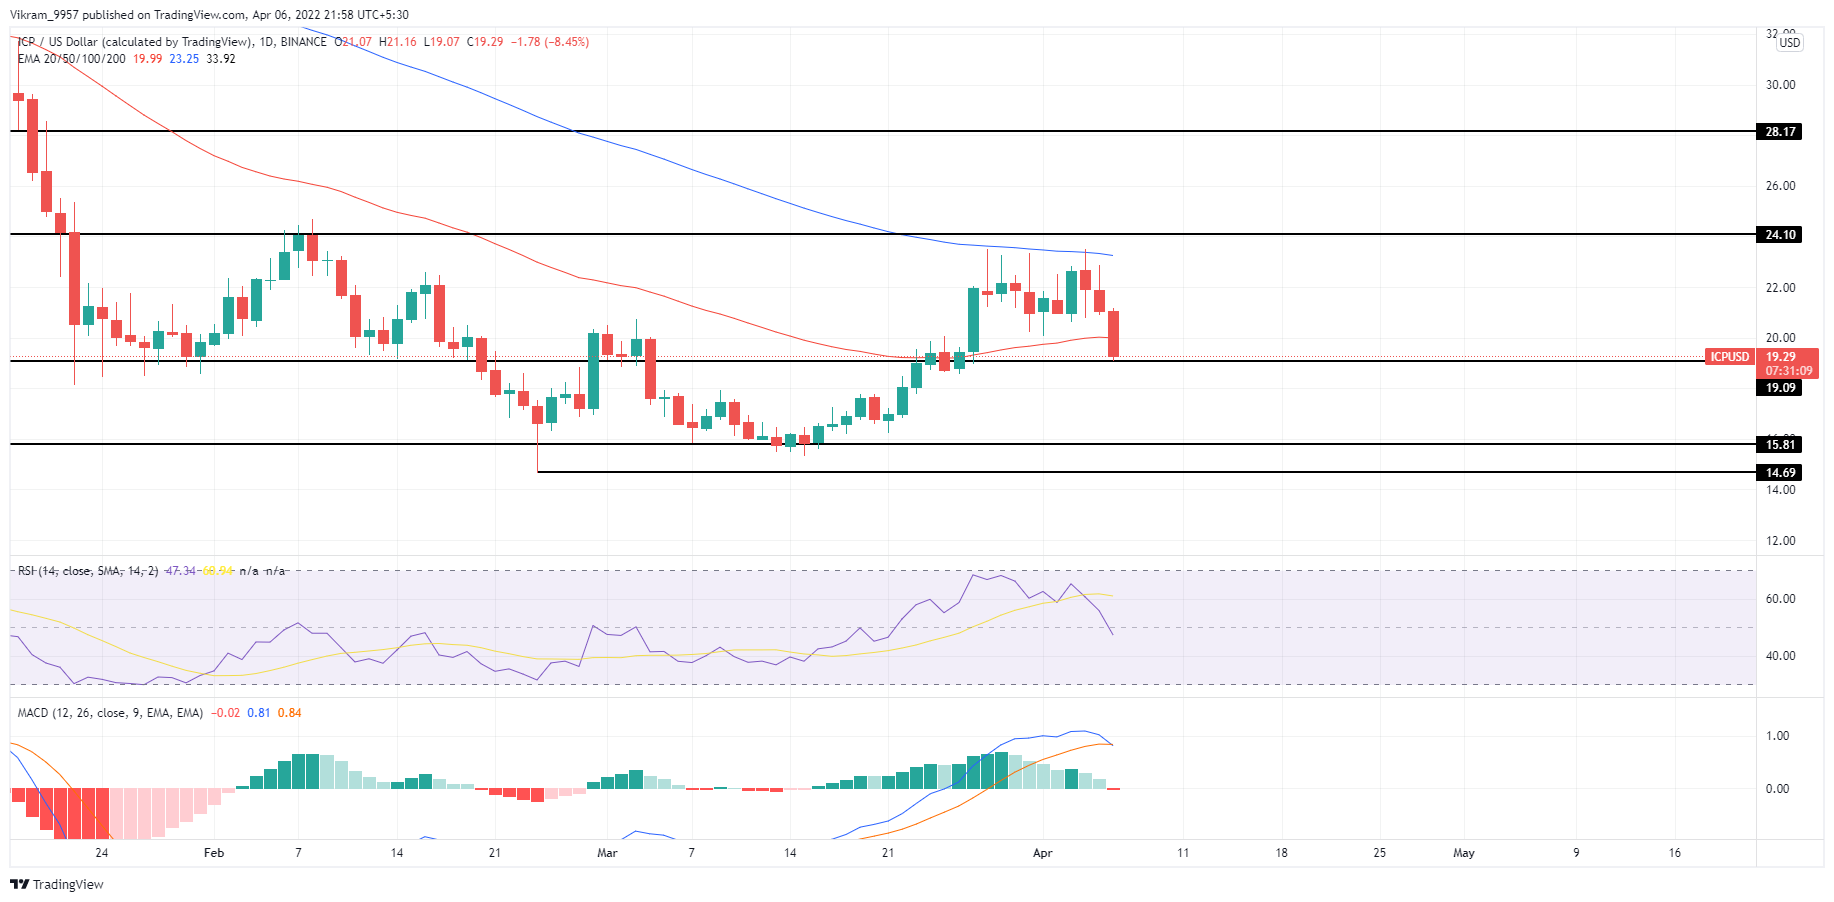 Source-Tradingview
$ICP Technical Analysis
$ICP coin price has fallen by 15% in the past 72 hours resulting in the double top fallout with the three black crows pattern. Hence, the increased selling pressure is evident in the price action and indicates a downfall below the $19 mark. The downtrend fueled by the rejection from the 100-day EMA breaks below the 50-day EMA and crushes the bullish crossover possibility. Hence, the 50-day EMA regains its resistance status as the market price is below all the crucial EMAs. RSI Indicator: The RSI slope falls from the nearly overbought territory as sellers step at the 70% mark, resulting in the 14-day average fallout. Moreover, the RSI slope falls under the halfway mark and reflects a rise in underlying bearishness. MACD Indicator: The MACD and signal lines give a bearish crossover after days of sideways trend in the positive territory resulting in a start of negative histograms in the daily chart. The $ICP technical analysis knocks off a highly bearish vibe with the rise in selling pressure.
Upcoming Trend
$ICP coin price falls incredibly as the sellers gain trend control and give a bearish pattern fallout. Hence, the $19 fallout becomes imminent and brings a selling opportunity with the potential of an 18% downfall to the $15 mark. Support Levels: $15.8 and $14.5 Resistance Levels: $20 and $22

 cryptoknowmics.com