Past Performance of $ROSE
$ROSE coin price has been rising in a parallel channel starting from the bottom at $0.21 in the third week of March. The rally inflated the prices by 50% in just 20 days and reached the $0.30 mark. However, the higher price rejection above $0.30 due to increased selling drove the prices below the support trendline. 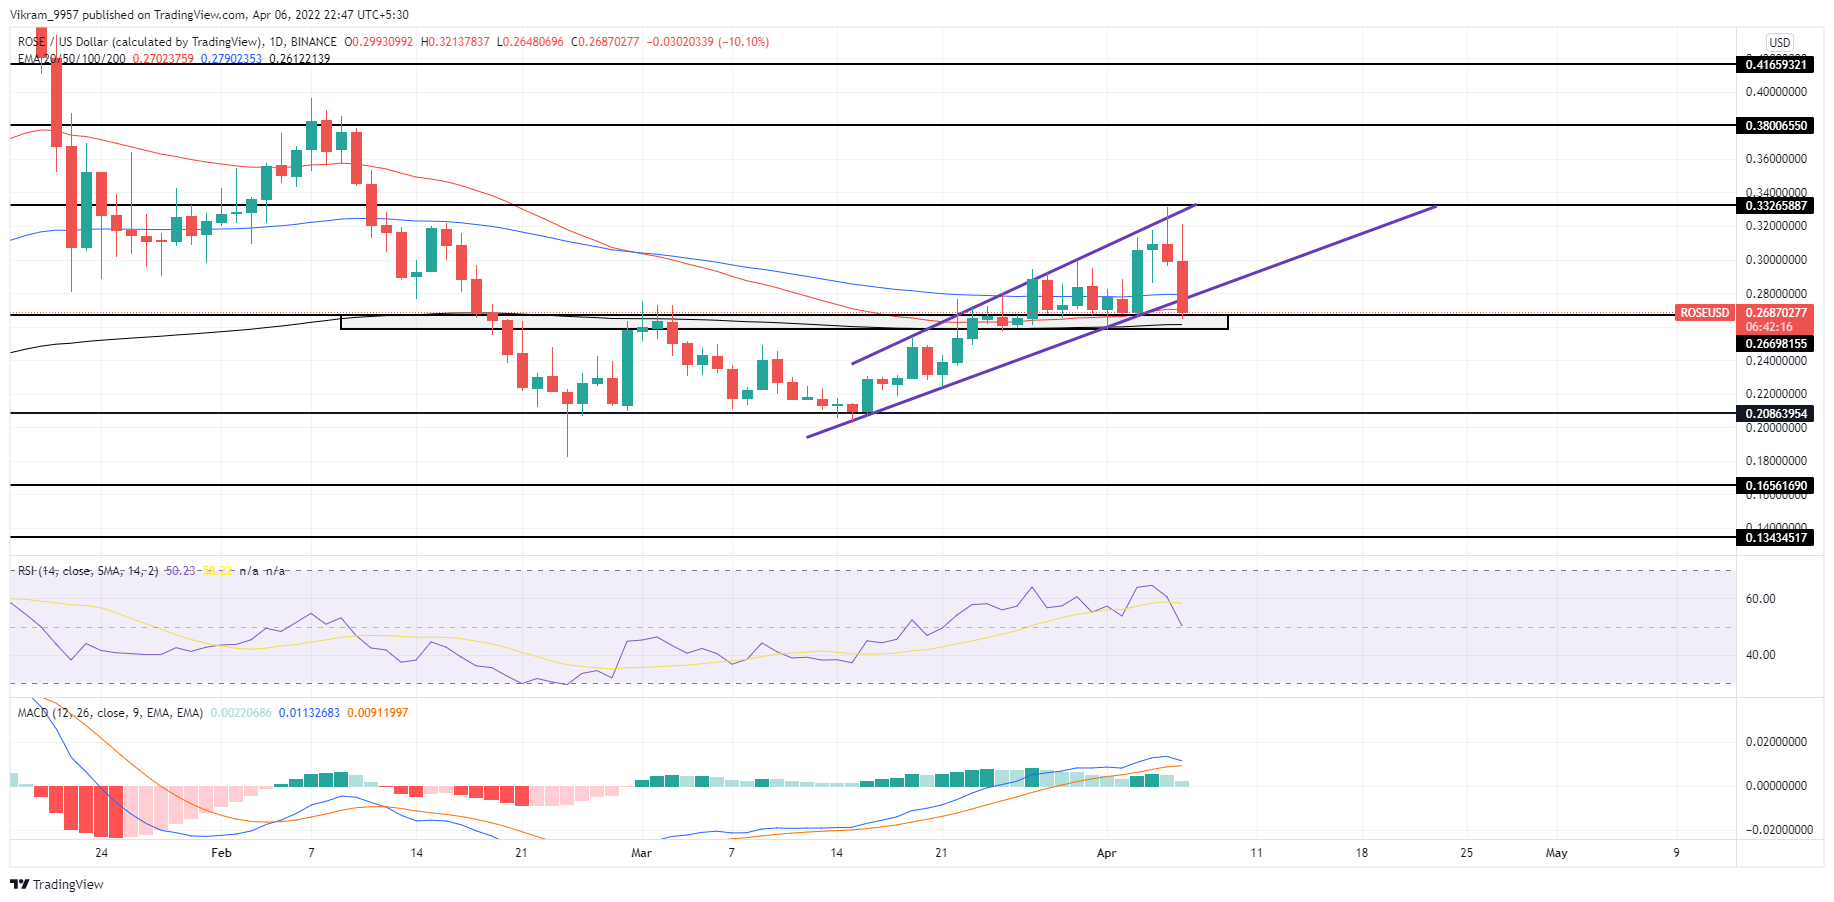 Source-Tradingview
$ROSE Technical Analysis
$ROSE coin price action creates a consecutive bearish candle with long wicks, accounting for a 15% fall within 48 hours. Hence, the advanced supply is apparent in the long wicks and bearish candles, indicating a high chance of falling below the $0.25 mark. The bearish trend breaks below the 100-day EMA and challenges the 50-day EMA. However, the 200-day EMA below the $0.25 support zone keeps the bullish reversal possibilities alive. RSI Indicator: The RSI slope faces rejection near the 70% boundary resulting in a reversal from the nearly overbought territory. Moreover, the falling RSI slope cracks under the 14-day average and reflects the increased bearish continuation possibility. MACD Indicator: The MACD and signal lines showcase a sharp decrease in the bullish spread and increase the chances of bearish crossover. Hence, the indicator projects a significant rise in underlying bearishness. The $ROSE technical analysis keeps a bearish bias as the bearish candle creeps into the $0.25 support zone.
Upcoming Trend
$ROSE coin price sinks below the rising channel as the supply pressure increases and warns against the support zone fallout. Therefore, the fallout will bring an excellent selling opportunity with a downtrend potential of 20% to hit the $0.20 mark if the 200-day EMA collapses. Support Levels: $0.25 and $0.20 Resistance Levels: $0.28 and $0.30

 cryptoknowmics.com