TL;DR Breakdown
- Tezos price analysis is bearish
- XTZ prices are facing resistance at $4.05
- Support for XTZ prices is present at $3.8

The Tezos price analysis for today indicates a downtrend that has seen Tezos prices decline by 3.76 percent. Tezos is currently trading at $3.82 after experiencing a high of $4.05 and a low of $3.77. The trading volume has been on the rise by 18.72 percent which is now sitting at $681,512,761.22.
The main resistance for XTZ prices is at the $4.05 mark, followed by support at the $3.8 level. If the XTZ/USD pair falls below the $3.8 support, it could pave the way for a further decline to the $3.6 level. On the other hand, if XTZ prices manage to break past the $4.05 resistance, it could signal a move towards the $4.3 level As of now, it is best to wait and see how the market develops before taking any further positions.
Tezos price analysis on a 1-day price chart: XTZ prices face resistance at $4.05
The 1-day price chart for Tezos price analysis shows that the downtrend has been continuing for the past few days. XTZ prices are facing resistance at the $4.05 mark, while the key support is at the $3.8 level. A break below this support could see XTZ prices decline to the $3.6 level. On the other hand, a break above the resistance could see XTZ prices move up to the $4.3 level. The MACD indicator is currently in the bearish zone, while the RSI is indicating oversold conditions.
The Fibonacci sequence, which is used to identify trend reversal points, shows that the current trend is likely to reverse sooner or later. As of now, it is best to wait and see how the market develops before taking any positions. However, the EMAs are still in favor of the bears and XTZ could slide down to test the $3.8 level once again in the short term.
Tezos price analysis on a 4-hour price chart: XTZ set to test the further downside
The 4-hours XTZ/USD price analysis is following the bearish trend as the price is currently facing resistance at the $4.05 mark. The key support is at the $3.8 level, which could be tested soon. The MACD line is currently residing on the bearish side, while the RSI is indicating oversold conditions. The sellers seem to be in control of the market at the moment and a further decline is expected. However, it is important to wait for a clear breakout before taking any positions.
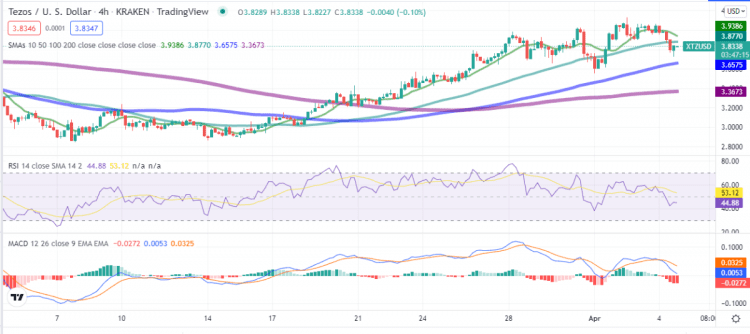
The RSI line is headed downwards whereas the moving averages are indicating a downtrend. The support at $3.8 is crucial for XTZ prices and if it gets broken, the next stop could be $3.6.The current market sentiment is attributed to the overall decline of XTZ prices. The main resistance is at the $4.05 mark, followed by support at the $3.8 level. Also the 50 days SMA is below the 200 days SMA, which indicates that the sellers are in control of the market and a further price decline is possible.
Tezos price analysis conclusion
The overall sentiment for XTZ is bearish, with the price facing resistance at the $4.05 mark. The key support lies at the $3.8 level, which could be tested in the future. observations from the Tezos price analysis for today show that the prices are likely to move downwards and test the $3.8 support shortly. Traders should wait for a clear trend reversal before taking any positions in XTZ. However, if XTZ prices manage to break past the $4.05 resistance, it could signal a move towards the $4.3 level.
Disclaimer. The information provided is not trading advice. Cryptopolitan.com holds no liability for any investments made based on the information provided on this page. We strongly recommend independent research and/or consultation with a qualified professional before making any investment decisions.