ZIL coin completes a bullish pattern teasing a 20% jump. Key technical points:
- The post-retest rally would soar ZIL price by 20%
- The upcurved 20-day EMA suggests the rising bullish momentum
- Finally, the 24-hour trading volume of Zilliqa is $85.5 Million, marking a 70.4% rise.
Past Performance of ZIL
The February sell-off plummeted the ZIL price to January low support at $0.377, resulting in a 35% devaluation. Furthermore, the buyers tried to breach the overhead ceiling of $0.466, but the sellers mounted a stiff resistance and reverted the coin to bottom support. The ZIL resonated between the mentioned levels for around a month, suggesting a range formation. 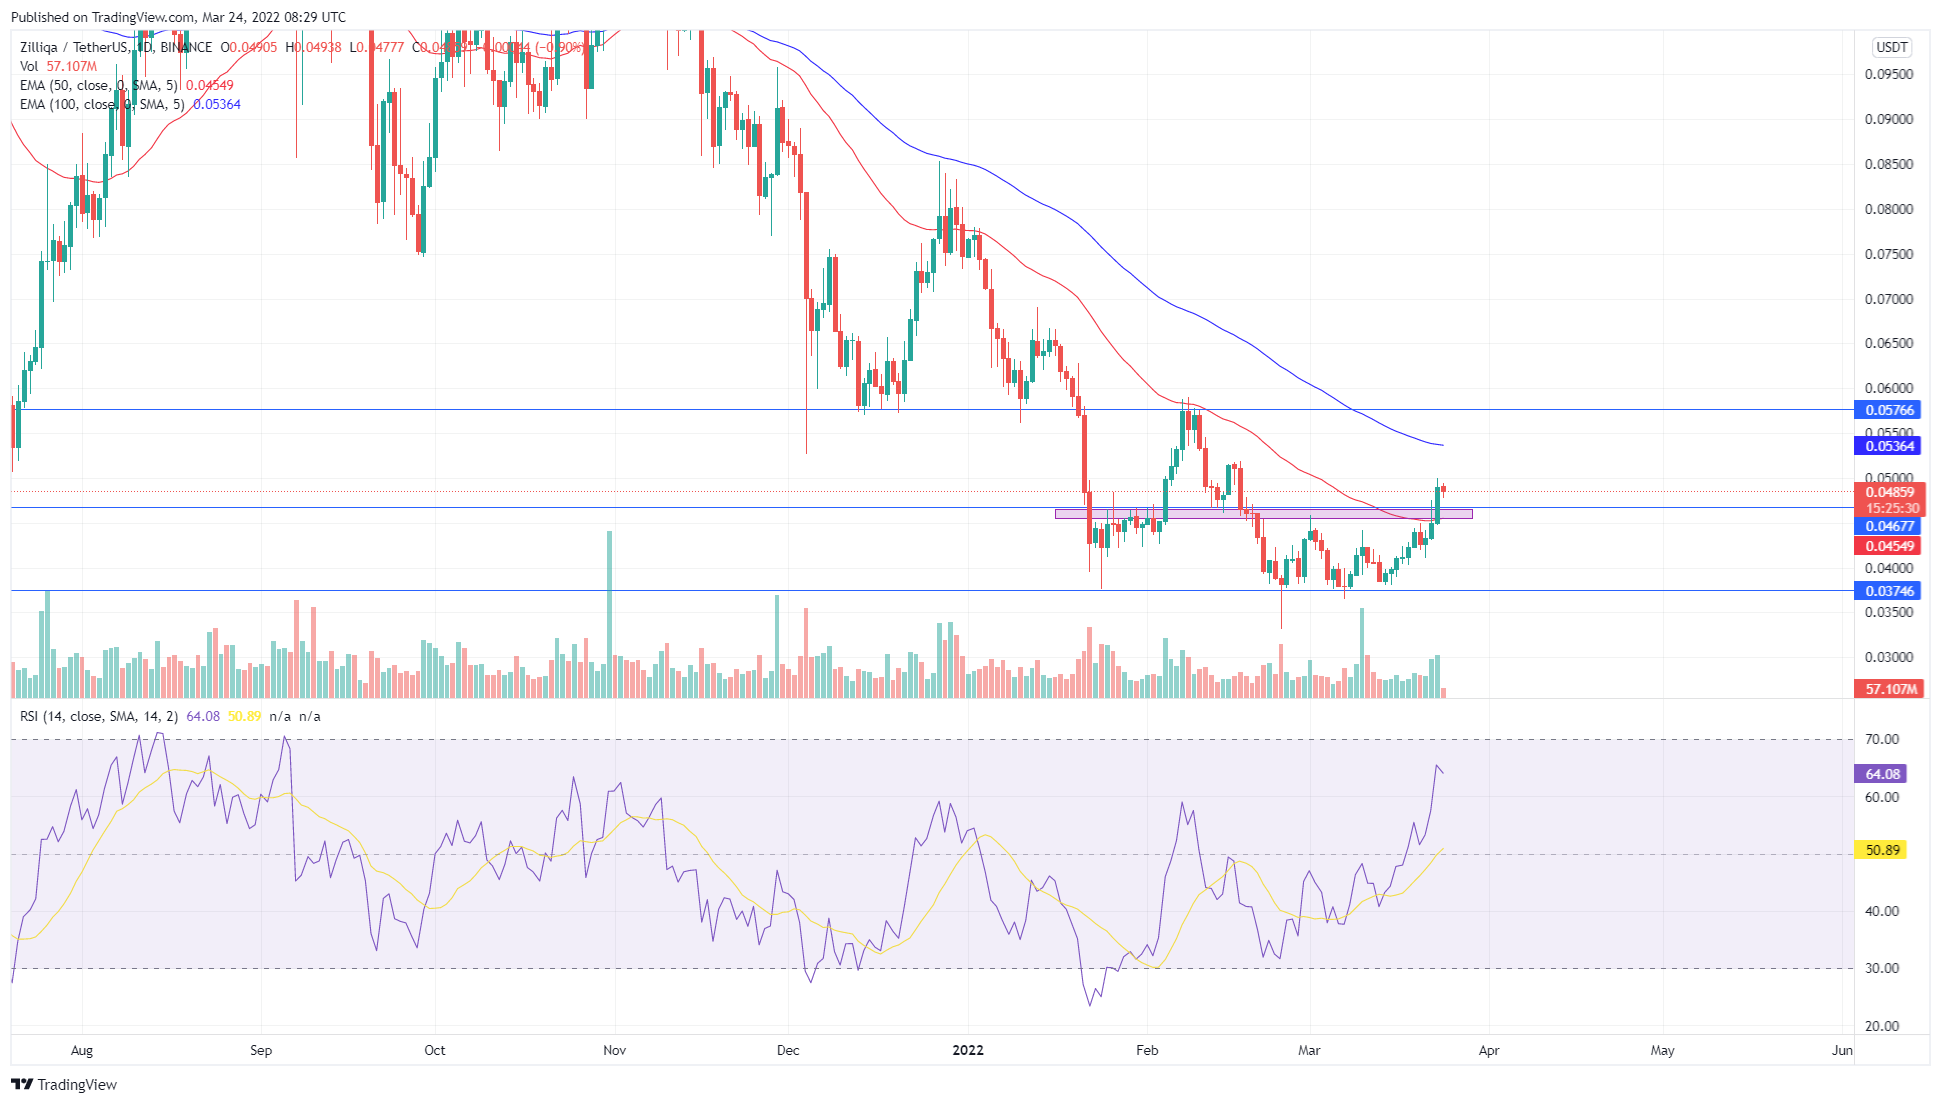 Source-Tradingview
ZIL Technical Analysis
During the consolidation phase, the Zilliqa price retested the $0.377 support thrice, suggesting a strong accumulation zone for long traders. The technical chart also indicated the formation of a bullish triple bottom with the neckline at $0.466. On March 23rd, the buyers gave a decisive breakout from the neckline resistance, providing a long entry opportunity for traders. The Recovery rally breached the 20-and-50-day EMAs, indicating buyers are wresting control from sellers. Moreover, the Zilliqa price could reclaim the 100-day EMA as the bullish momentum grows. RSI Indicator: Following an evident bullish divergence, the RSI slope shows a parabolic rally charging stringent to the overbought region. MACD Indicator: The MACD and signal lines gradually approaching the equilibrium suggest the rising bullish momentum. The indicator line could soon breach the midline, providing additional confirmation. In a nutshell, the ZIL technical analysis gives a solid bullish signal with the breakout possibility of the 100-day EMA.
Upcoming Trend
Sustaining the current retest phase, the potential rally could spike the ZIL price 20% high to the $0.58 resistance. The possible resistance that long traders could face during the journey would be $0.52 and 100-day EMA. However, a downside possibility is the $0.046 fallout resulting in the fall to $0.042, followed by $0.037 Support Levels: $0.046 and $0.042 Resistance Levels: $0.052 and $0.058